![]() Figure 2 of
Churchill, Mol Vis 2005;
11:66-70.
Figure 2 of
Churchill, Mol Vis 2005;
11:66-70.
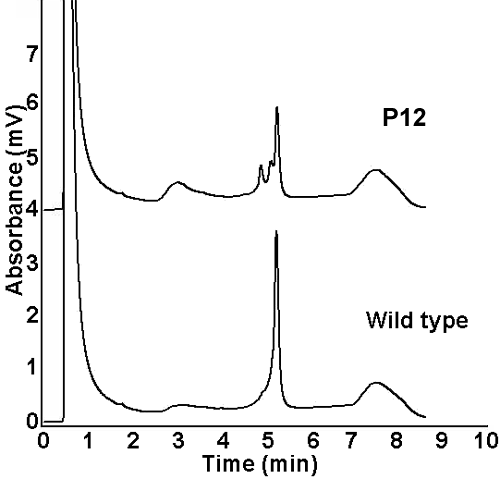
Figure 2. Chromatogram of Fragment 3A demonstrating a normal wild type and abnormal pattern
Chromatograms of fragment 3A, from the Transgenomic Wave® analyzer, demonstrating a "triple peak" in individual P12 compared to the "single peak" observed in the wild type. The triple peak was observed in 12 individuals and indicates a deviation from the wild type DNA sequence in this fragment.
