![]() Figure 2 of
Willoughby, Mol Vis 2005;
11:587-593.
Figure 2 of
Willoughby, Mol Vis 2005;
11:587-593.
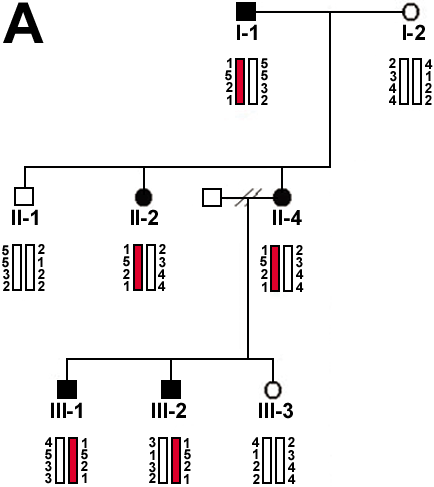
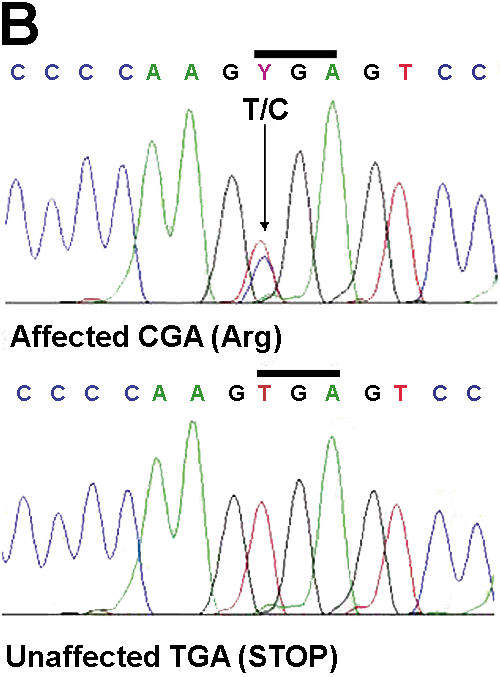
Figure 2. CRYBB1 mutational and segregation analysis
A: SSCP analysis of a representative sample of the family showing complete segregation with the affection status. B: DNA sequence chromatograms of the X253R mutation in CRYBB1. Blackened symbols (I-1, II-2, II-4, III-1, and III-2) refer to the affected status whereas unblackened symbols represent unaffected relatives (I-2, II-1, and III-3).