![]() Figure 4 of
Jablonski, Mol Vis 2005;
11:569-581.
Figure 4 of
Jablonski, Mol Vis 2005;
11:569-581.
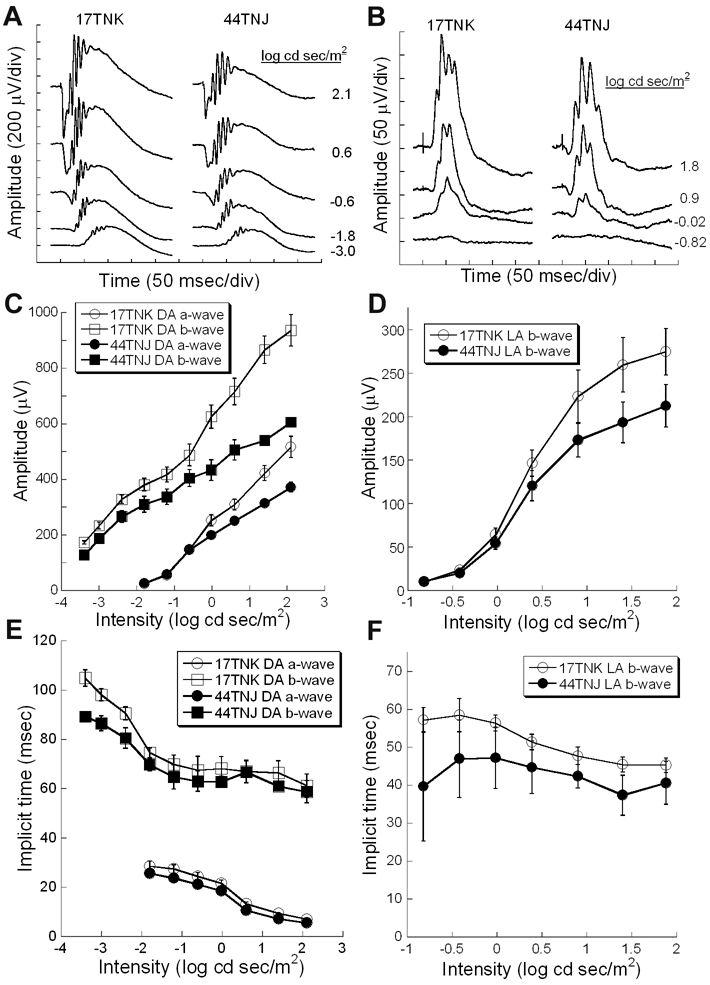
Figure 4. Electroretinography recordings from 44TNJ mice compared to 17TNK controls
Dark-adapted (A) and light-adapted (B) ERG waveforms from 17TNK and 44TNJ in response to increasing flash intensities are shown. Each waveform is the average of 5-10 responses recorded from a representative mouse. C: ERG a- and b-wave amplitude values for each stimulus tested under dark-adapted conditions are shown. The 44TNJ mice have significantly reduced responses at brighter flash intensities compared to 17TNK mice. D: Light-adapted ERG amplitudes across the flash intensities tested. Differences between mutant and control responses at the same intensities are not statistically significant. Implicit time (E) for the dark-adapted responses showed no differences between mutant and control mice across flash intensities. The implicit time of the light-adapted responses (F) in the 44TNJ mice were significantly faster than 17TNK controls. All error bars represent standard error of the mean.
