![]() Figure 2 of
Zhang, Mol Vis 2005;
11:554-560.
Figure 2 of
Zhang, Mol Vis 2005;
11:554-560.
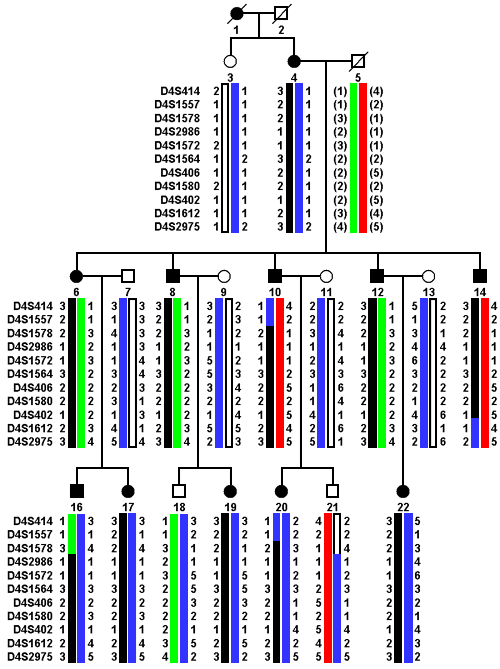
Figure 2. Pedigree and haplotype diagram of the family with high myopia
Black bars represent the disease allele. The white, green, blue, and red bars are all normal alleles and indicate how the different alleles are transmitted in the family. Squares or circles filled with black indicate individuals affected with high myopia.