![]() Figure 1 of
van der Spuy, Mol Vis 2005;
11:542-553.
Figure 1 of
van der Spuy, Mol Vis 2005;
11:542-553.
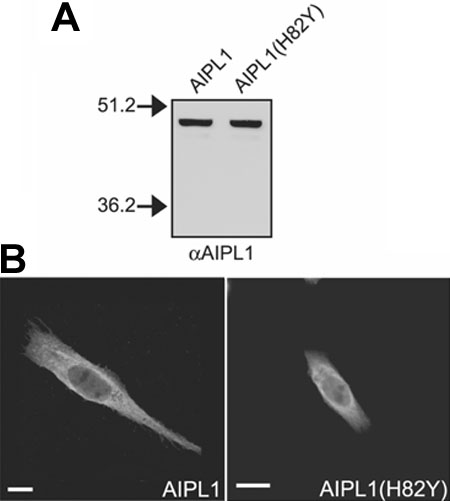
Figure 1. Characterization of AIPL1(H82Y)
Characterization of AIPL1(H82Y) solubility, subcellular distribution, and NUB1 modulation in SK-N-SH cells is shown. A: Western analysis of AIPL1 and AIPL1(H82Y) in SK-N-SH soluble extracts detected with the Ab-hAIPL1 antibody (αAIPL1) [11]. B: Immunofluorescent confocal microscopy of the subcellular distribution of AIPL1 and AIPL1(H82Y) in SK-N-SH cells. Scale bar represents 10 μm. pEGFP-C1-NUB1 (C), pEGFP-C1-NUB1-N (D), or pEGFP-C2-NUB1-C (E) were co-transfected with pCMV-Tag3C-AIPL1 or pCMV-Tag3C-AIPL1(H82Y) at a ratio of 1:0, 1:0.5, 1:1, and 1:2 with the total amount of transfected DNA (150 ng) maintained by the addition of pCMV-Tag3C. C: The percentage fluorescence OD of GFP-NUB1 in the nucleus in the absence (CON) and presence of AIPL1 or AIPL1(H82Y) shown at a transfection ratio of 1:2. The mean OD of the nucleus was multiplied by the area of the nucleus and calculated as a percentage of the mean OD multiplied by the area of the total cell. D: Cell counts of the percentage of GFP-NUB1-N transfectants with perinuclear inclusions in the absence (CON) or presence of AIPL1 or AIPL1(H82Y) shown at a transfection ratio of 1:0.5. E: Cell counts of the percentage of GFP-NUB1-C transfectants with intranuclear inclusions in the absence (CON) or presence of AIPL1 or AIPL1(H82Y) shown at a transfection ratio of 1:2. The error bars represent the standard deviation.