![]() Figure 4 of
Kyselova, Mol Vis 2005;
11:56-65.
Figure 4 of
Kyselova, Mol Vis 2005;
11:56-65.
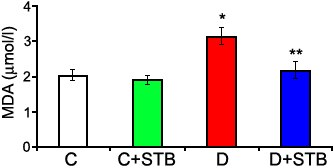
Figure 4. Levels of malondialdehyde (MDA) in rat plasma at the end of week 18
The experimental groups are: control rats on standard diet (C; white); control rats treated with stobadine (0.05% w/w stobadine dipalmitate; C+STB; green); untreated diabetic rats (D; red); and diabetic rats treated with stobadine (0.05% w/w stobadine dipalmitate; D+STB; blue). Statistical analysis of the data was done using Student's t-test. The single asterisk indicates a p<0.05 compared to control rats on standard diet (C) and the double asterisk indicates a p<0.05 compared to untreated diabetic rats (D). Bars represent means; error bars represent the SEM.
