![]() Figure 4 of
Roldan-Pallares, Mol Vis 2005;
11:461-471.
Figure 4 of
Roldan-Pallares, Mol Vis 2005;
11:461-471.
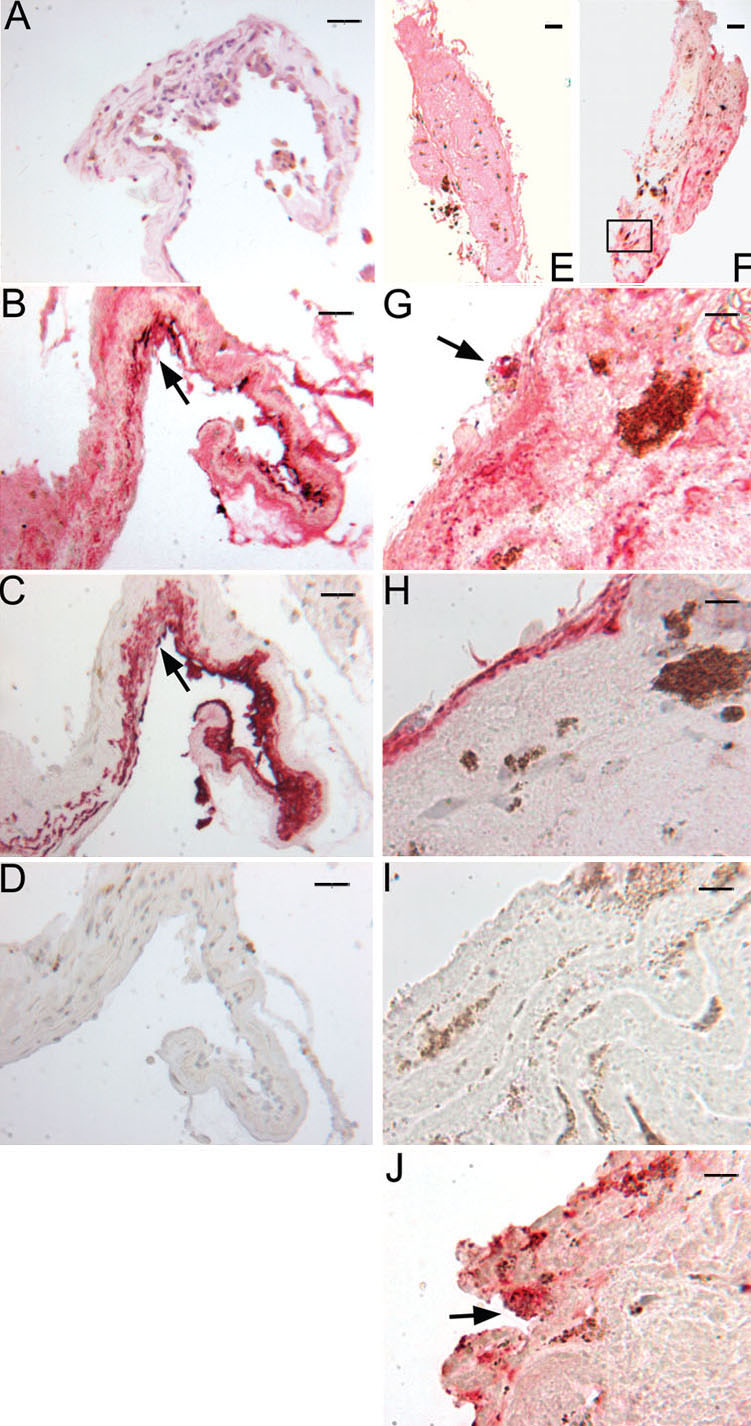
Figure 4. Immunohistochemical staining for the anti-ET-1 antibody in ERMs
Photomicrographs show immunohistochemistry for ET-1, GFAP, and cytokeratin, localizing ET-1 immunoreactivity in an IERM and in an ERM from PVR. A-D show images of an IERM; E-J show images of an PVR membrane. B,F,G show diffuse distribution of ET-1 protein expression by stromal and cellular components of the membranes (G is a magnified view of the boxed area in F). A,E are hematoxylin and eosin images (magnification 25x). Positive staining for both ET-1 and GFAP shown by glial cells (B,C: IERM; G,H: PVR membrane; magnification 40x). Positive staining for both ET-1 and cytokeratin shown by RPE cells (G,J: PVR membrane; magnification 40x; arrow in J correspond to the same area of arrow in G). D,I show the negative controls for IERM and PVR membranes, respectively. Scale bars represent 100 μm in E,F and represent 50 μm in A-D,G-J.