![]() Figure 5 of
Hollborn, Mol Vis 2005;
11:397-413.
Figure 5 of
Hollborn, Mol Vis 2005;
11:397-413.
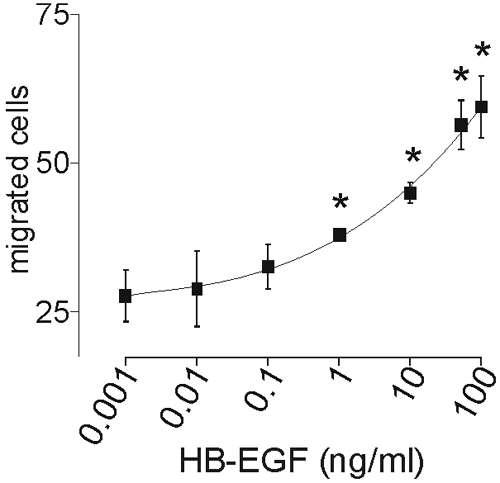
Figure 5. Concentration-dependent chemotaxis of cells of the human Müller cell line, MIO-M1, toward HB-EGF
The data represent cell migration rates in treated wells relative to that in wells without HB-EGF. Each square represents the mean of two independent cultures in experiments having five repeats each; error bars represent SEM. The asterisks indicate a statistically significant difference (p<0.05) compared with untreated control.
