![]() Figure 1 of
Hollborn, Mol Vis 2005;
11:397-413.
Figure 1 of
Hollborn, Mol Vis 2005;
11:397-413.
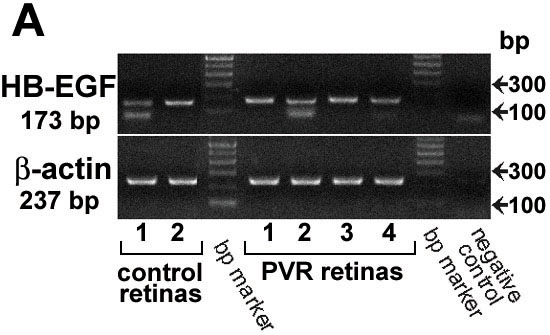
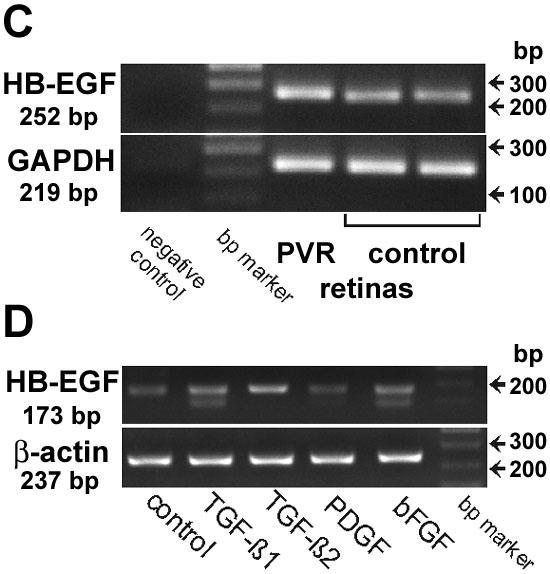
Figure 1. Expression of the mRNA for HB-EGF in human retinas and in the human Müller cell line, MIO-M1
A: Results of RT-PCR analysis using cDNA of four different retinas of patients with PVR and of two control retinas. The β-actin PCR was performed as control for the quality of the RNA used. B: Real-time PCR analysis of HB-EGF and GAPDH mRNA expression with cDNA of two control postmortem retinas and of one PVR retina. Similar results were obtained in four control retinas and three PVR retinas (data not shown). While the threshold cycle numbers of GAPDH mRNAs were similar in control and PVR retinas, a difference in the expression levels of the HB-EGF mRNAs was observed. The PCR cycle number is plotted against fluorescence intensity. C: Ethidium bromide stained agarose gel of the PCR products. Each reaction product yielded a single band, which was confirmed by melting curve analysis (data not shown). D: RT-PCR carried out with RNA of cultured Müller cells. The cultures were investigated under control conditions and after a 24 h stimulation with TGF-β1, TGF-β2, platelet derived growth factor-BB (PDGF), and bFGF at 10 ng/ml. E: Fold changes in HB-EGF mRNA expression in MIO-M1 cells after stimulation with different cytokines for 24 h. Bars represent means of 3 to 5 independent experiments carried out in duplicate; error bars represent SEM. Single (p<0.05) and double asterisks (p<0.01) indicate statistically significant difference when compared to an untreated control.