![]() Figure 3 of
Chidlow, Mol Vis 2005;
11:387-396.
Figure 3 of
Chidlow, Mol Vis 2005;
11:387-396.
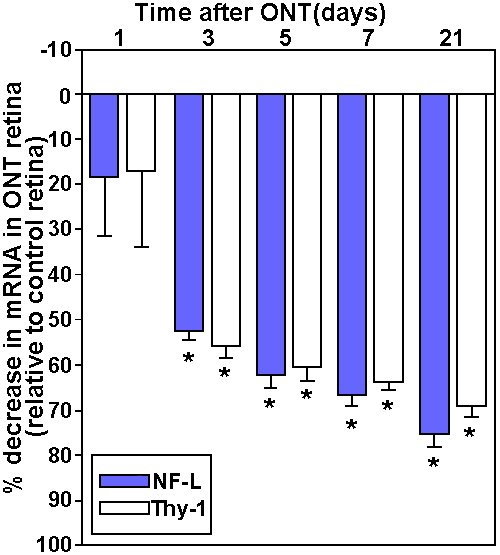
Figure 3. The effect of ONT on the levels of Thy-1 and NF-L mRNAs in the rat retina after 1, 3, 5, 7, and 21 days
All rats received ONT in the treated eye while the fellow eye served as a control. In each case, values (bars represent means, error bars represent SEM) are normalized for GAPDH and expressed as the percentage change in the ONT retina relative to the control retina, where n=17 (21 days), n=20 (7 days), n=6 (5 days), n=9 (3 days), and n=8 (1 day). An asterisk (*) denotes p<0.001 using Student's paired t-test (treated compared to control eye).
