![]() Figure 2 of
Chidlow, Mol Vis 2005;
11:387-396.
Figure 2 of
Chidlow, Mol Vis 2005;
11:387-396.
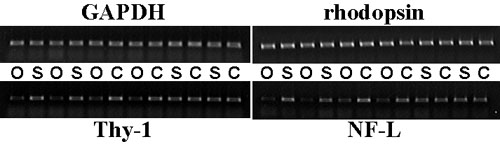
Figure 2. The effect of ONT and sham operation on the levels of Thy-1, NF-L and rhodopsin mRNAs in the rat retina after 21 days
A: Data from three treatment groups are shown. Group 1 received ONT in the treated eye while the control eye was untreated (ONT control). Group 2 received ONT in the treated eye and a sham operation in the control eye (ONT sham). Group 3 received a sham operation in the treated eye while the control eye was untreated (sham control). In each case, values (bars represent means, error bars represent SEM) are normalized for GAPDH and expressed as the percentage change in the treated retina relative to the control retina (Group 1: n=17; Group 2: n=5; Group 3: n=5). An asterisk (*) denotes p<0.01 and double asterisks (**) denote p<0.001 using Student's paired t-test (treated compared to control eye). B: Sample gels from two animals in each group are shown; for each of the indicated mRNAs, the ONT (O), sham (S), and control (C) retinas showed the same bands.
A:
B: