![]() Figure 2 of
Danciger, Mol Vis 2005;
11:374-379.
Figure 2 of
Danciger, Mol Vis 2005;
11:374-379.
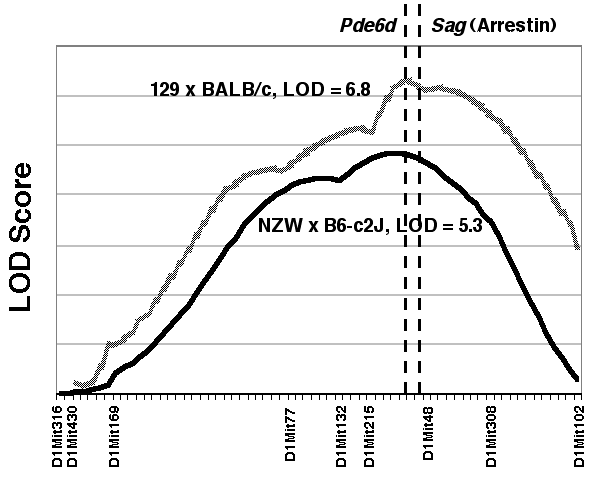
Figure 2. Interval map of the middle Chr 1 QTL
Interval map of the likelihood ratio statistic (converted to LOD scores) produced by Map Manager QTX of the middle Chr 1 QTL from this NZWxB6al study and from an intense light-induced retinal degeneration study involving the 129S1/SvImJ and BALB/c strains [9]. Each hash mark on the X-axis represents 1 cM.
