![]() Figure 4 of
Reiners, Mol Vis 2005;
11:347-355.
Figure 4 of
Reiners, Mol Vis 2005;
11:347-355.
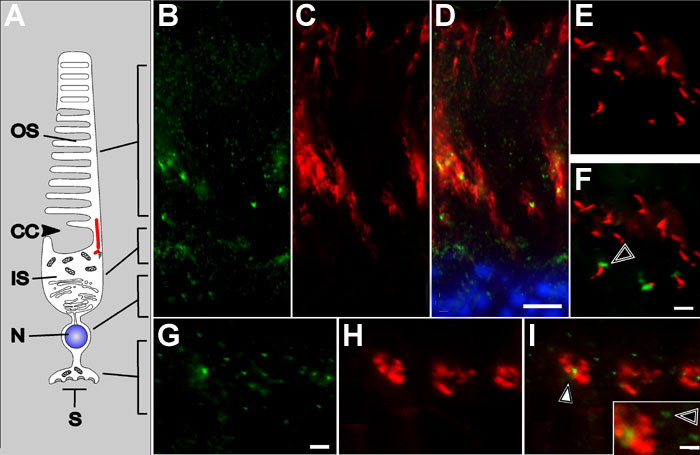
Figure 4. Subcellular localization of Pcdh15 in cone photoreceptor cells
A: Schema of a cone photoreceptor cell. In comparison with rods, cone outer segments (OS) are shorter and their OS disks are laterally open to the extracellular space. OS represents outer segment; CC represents connecting cilium; IS represents inner segment; N represents nucleus localized in the outer nuclear layer (ONL), and S represents synaptic terminal located in the outer plexiform layer (OPL) of the retina. B-I: Fluorescence microscopy of a longitudinal cryosection through a mouse retina. B: Indirect immunofluorescence of anti-Pcdh15 was present in dot-like structures of distinct sizes in the layer of photoreceptor outer segments. C: Double labeling with a fluorescein conjugated lectin, PNA, was used as a marker for the matrix sheath of cones. D: Overlay of B and C, triple labeled with DAPI (blue). Intense Pcdh15 staining was present in cones (yellow), while small dots were localized to rod inner and outer segments. E,F: Double immunofluorescence labeling of sections through photoreceptor cells at the inner-outer segment joint with anti-Pcdh15 and anti-centrin (clone 20H5). E: Centrins are localized in the connecting cilia and basal bodies of rods and cones [43]. F: Merged images revealed Pcdh15 localization in outer segment the bases distally to anti-centrin stained connecting cilia (arrow). G-I: Indirect immunofluorescence double labeling of a cryosection through the outer plexiform layer of a mouse retina with anti-Pcdh15 and fluorescein conjugated PNA. G: Dots of different diameters are stained by anti-Pcdh15. H: Fluorescent conjugated PNA stained cone synapse pedicles. I: Overlay of images G and H shows intense anti-Pcdh15 labeling of large dots, present in the notch of the PNA labeling in cone synapses (white arrow). Beneath the cone pedicles numerous dots of smaller diameter are only stained by anti-Pcdh15 (green), which represent the smaller rod spherule. The scale bars in D and G represent 5 μm; the scale bars in F and the inset of I represent 2 μm. Use the scale bar in D for B-D, the scale bars in G for G-I, and the scale bars in F and the inset of I for E,F and the inset of I.