![]() Figure 2 of
Paull, Mol Vis 2005;
11:328-334.
Figure 2 of
Paull, Mol Vis 2005;
11:328-334.
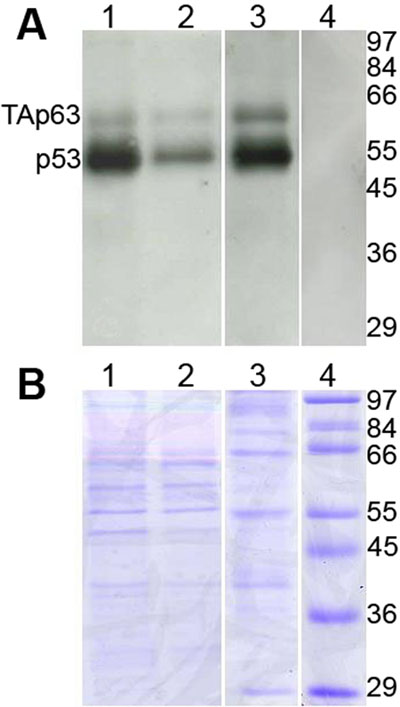
Figure 2. Protein expression of p53 and TAp63 in human corneal endothelial cells
A: Western blot labeled for p53 and p63. The p53 bands migrated to the expected position of 53 kDa. The p63 bands migrated to 60 kDa, which is consistent with the TAp63 isoform. B: Equal amounts of protein were loaded in each lane, with a sample of total protein distribution shown in the CB stain. Lane 1: Central tissue. Lane 2: Peripheral tissue. Lane 3: Positive control. Lane 4: Molecular marker.