![]() Figure 5 of
Liu, Mol Vis 2005;
11:321-327.
Figure 5 of
Liu, Mol Vis 2005;
11:321-327.
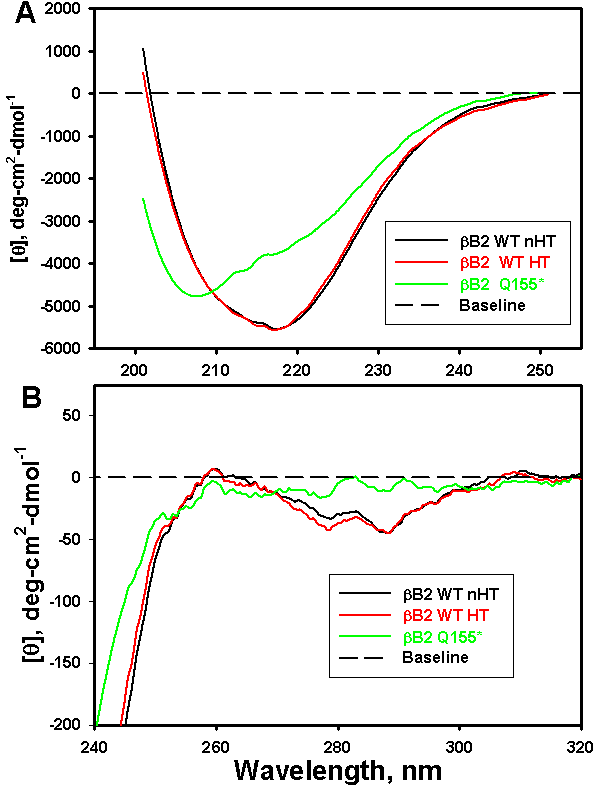
Figure 5. Far and near UV CD of βB2-crystallin
The decreased ordered secondary and tertiary structures for the Q155* mutant were demonstrated by far and near UV CD. A: Far UV CD of βB2-crystallin. Untagged WT βB2-crystallin is represented by the black curve. B: Near UV CD of βB2-crystallin. Untagged WT βB2-crystallin is represented by the black curve. Protein concentrations were 0.1-0.3 mg/ml and cell pathlengths were 1 mm for the far UV and 10 mm for the near UV region.