![]() Figure 9 of
Brand, Mol Vis 2005;
11:309-320.
Figure 9 of
Brand, Mol Vis 2005;
11:309-320.
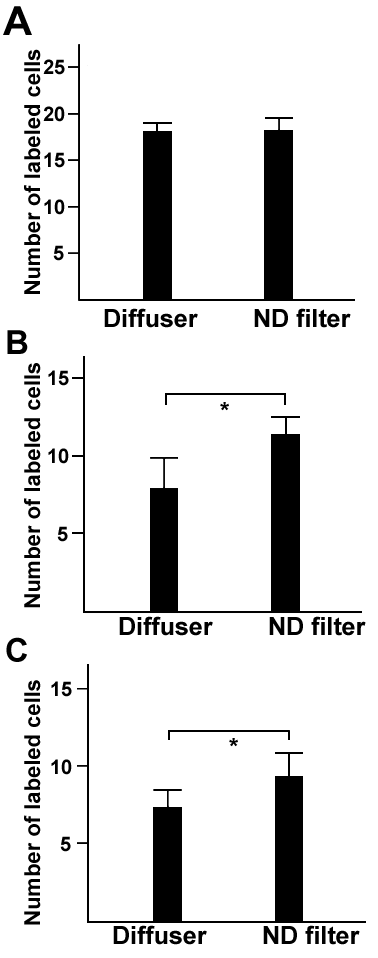
Figure 9. Retinal Egr-1 protein expression in diffuser and ND filter treated eyes
Numbers of amacrine cells (A), bipolar cells (B) and cells of the ganglion cell layer (C) that were labeled for Egr-1 protein after a 60 min treatment with diffusers and intensity matched ND filters. Cell counts given in the figure correspond to cells in four microscope fields. Error bars represent the standard error of the mean. Paired t-tests were used for statistical analyses; the asterisk indicates a statistical difference between the groups (p<0.05). The sample size is 6 animals per group.
