![]() Figure 7 of
Brand, Mol Vis 2005;
11:309-320.
Figure 7 of
Brand, Mol Vis 2005;
11:309-320.
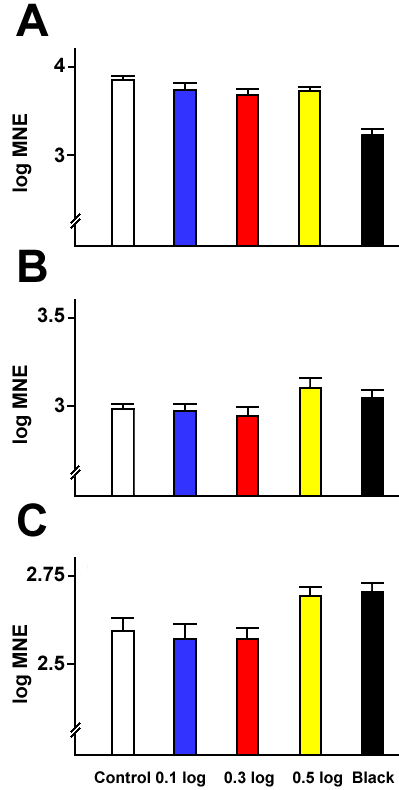
Figure 7. Measurement of EGR-1, VIP and Shh mRNA concentrations after bilateral treatment with neutral density filters and black diffusers.
Measurement of retinal mRNAs after bilateral treatment with different ND filters or blackened diffusers for 30 min. Error bars represent the standard error of the mean. The detailed results of the post-hoc analysis are given in the text. The sample size is 5 animals per group.
