![]() Figure 3 of
Brand, Mol Vis 2005;
11:309-320.
Figure 3 of
Brand, Mol Vis 2005;
11:309-320.
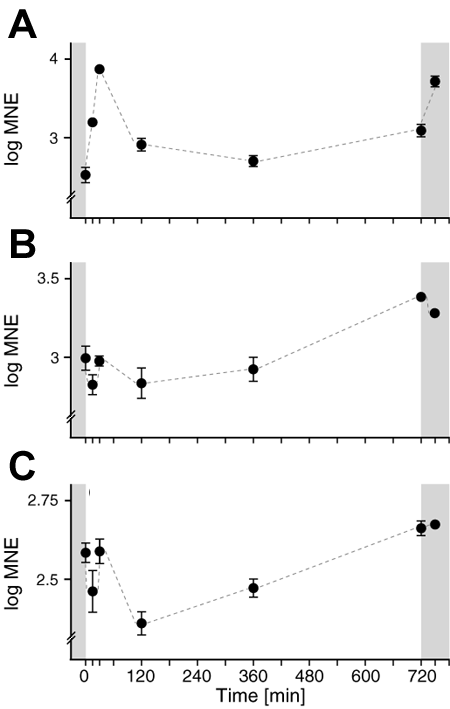
Figure 3. Retinal Egr-1, VIP, and Shh mRNA expression in control animals over time
The changes of retinal Egr-1 (A), VIP (B), and Shh (C) mRNA concentrations in control animals over time. The gray bars correspond to lights off. Error bars represent the standard error of the mean. The detailed results of the post-hoc analysis are given in the text. The sample size is 5 animals per group.
