![]() Figure 10 of
Brand, Mol Vis 2005;
11:309-320.
Figure 10 of
Brand, Mol Vis 2005;
11:309-320.
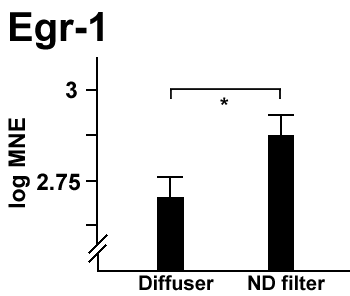
Figure 10. Retinal Egr-1 mRNA expression after diffuser and ND filter treatment in a visually refined environment
Treatment with diffusers and matched ND filters in a visually refined environment. Error bars represent the standard error of the mean. A paired t-test was used for statistical analysis; the asterisk indicates a statistical difference between the groups (p<0.05). The sample size is 6 animals per group.
