![]() Figure 3 of
Hawse, Mol Vis 2005;
11:274-283.
Figure 3 of
Hawse, Mol Vis 2005;
11:274-283.
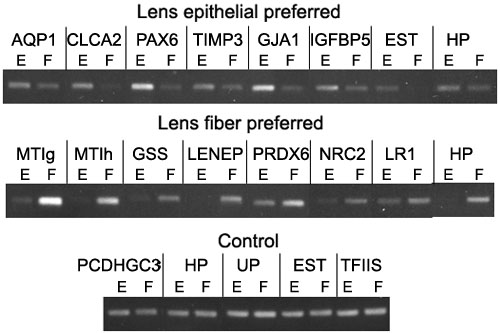
Figure 3. RT-PCR confirmation of gene expression differences
The expression levels of indicated genes were confirmed by semi-quantitative RT-PCR using 100 ng of RNA isolated from lens epithelial (E) or cortical fiber (F) cells.