![]() Figure 2 of
Hawse, Mol Vis 2005;
11:274-283.
Figure 2 of
Hawse, Mol Vis 2005;
11:274-283.
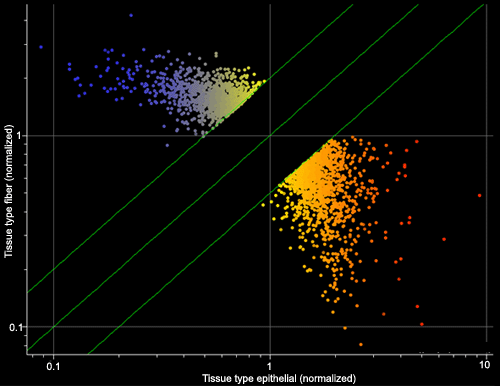
Figure 2. GeneSpring scatter plot
Each point represents an individual gene that is either upregulated in lens epithelial cells relative to cortical fiber cells (lower right quadrant) or that is downregulated in lens epithelial cells relative to cortical fiber cells (upper left quadrant). The center green line represents no difference in expression level for a given gene between the two cell types while the upper and lower green line indicate the 2 fold change cut off used in the present study.
