![]() Figure 1 of
Hawse, Mol Vis 2005;
11:274-283.
Figure 1 of
Hawse, Mol Vis 2005;
11:274-283.
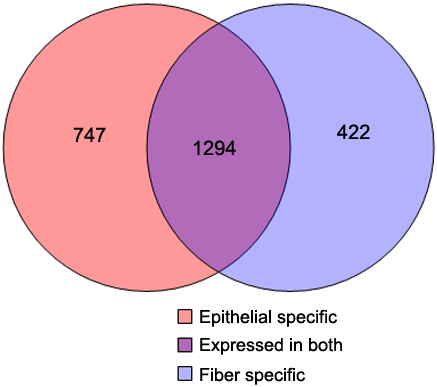
Figure 1. Venn diagram of detected gene expression differences
Venn diagram indicating number of genes expressed only in lens epithelial cells, only in cortical fiber cells, or in both cell types, as detected by microarray analysis.
