![]() Figure 2 of
Beltran, Mol Vis 2005;
11:232-244.
Figure 2 of
Beltran, Mol Vis 2005;
11:232-244.
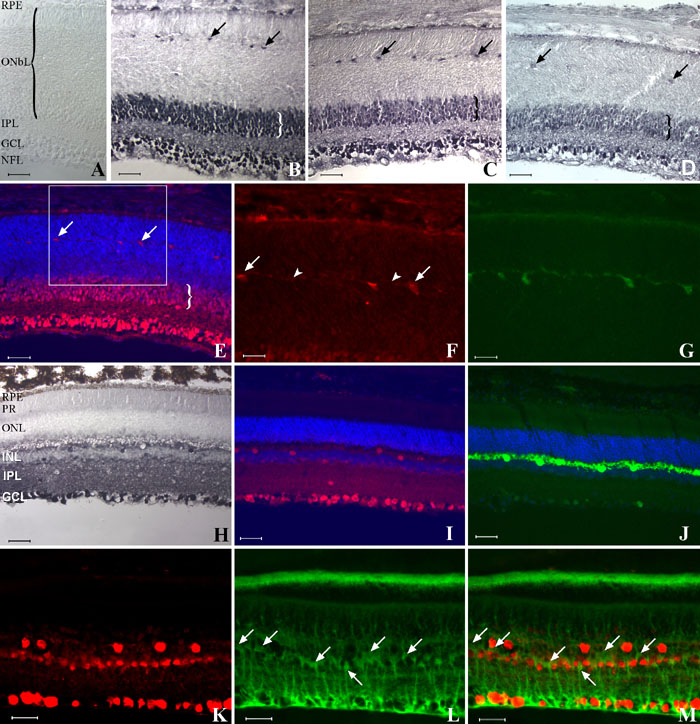
Figure 2. Immunolocalization of CNTFRα in the developing and adult rat retina
A: Negative control. B,C: Pattern of immunoenzymatic labeling with the anti-chick CNTFRα antibody in 3-day-old (B) and 6-day-old (C) rat retinas. D: Pattern of immunoenzymatic labeling with the anti-human CNTFRα antibody in a 6-day-old retina. E: Immunofluorescence labeling (overlaid images) with the anti-chick CNTFRα antibody (red) and DAPI (blue) on a 6-day-old retina. Intense labeling with the CNTFRα antibodies (B-E) was observed in the developing retina at the level of the ganglion cell layer (GCL), retinal pigment epithelium (RPE), and in two distinct areas of the outer neuroblastic layer (ONbL): the inner 6-7 rows of nuclei (braces in B-E) and in horizontal cells (arrows). F: Boxed region in E showing only CNTFRα labeling. Distinct horizontal processes (arrowheads) were seen extending from the labeled cell bodies (arrows) of the horizontal cells. G: Immunofluorescence labeling of horizontal cells with the calbindin antibody showing a similar pattern as observed in F. H: Pattern of immunoenzymatic labeling with the anti-chick CNTFRα antibody in an adult rat retina. Intense labeling was present at the level of the GCL and cells at the innermost and outermost border of the inner nuclear layer (INL). No labeling of photoreceptor cells was observed. I: Immunofluorescence labeling (overlaid images) with the anti-chick CNTFRα antibody (red) and DAPI (blue) on the adult retina seen in H. Absence of staining in photoreceptors and RPE was observed. Note that this rat's RPE is pigmented (seen in H), but no labeling of the RPE is observed by immunofluorescence. J: Sequential section labeled with the calbindin antibody. K: Immunofluorescence from staining with the anti-chick CNTFRα antibody. L: Immunofluorescence from staining with the rCRALBP antibody. M: Double immunofluorescence (overlaid images) with the anti-chick CNTFRα and rCRALBP antibodies. There is no co-localization of CNTFRα immunoreactive cells in the INL with the soma of Müller cells (arrows in L,M). Scale bars represent 40 μm (A-E,H-J) or 20 μm (F,G,K-M).