![]() Figure 4 of
Garcia-Valenzuela, Mol Vis 2005;
11:225-231.
Figure 4 of
Garcia-Valenzuela, Mol Vis 2005;
11:225-231.
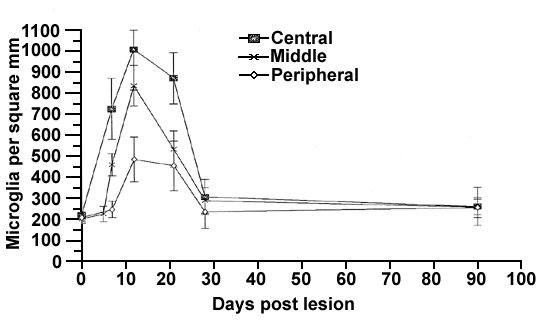
Figure 4. Post-axotomy changes of microglial density in different retinal eccentricities
Graph showing the mean number (error bars represent SEM) of microglial cells per mm2 in retina of the adult rat at 0, 5, 7, 12, 21, 28, and 90 days following optic nerve section, identified by OX42 labeling. Analysis across 3 different retinal eccentricities from the optic disc: central (0.5-1.5 mm), middle (1.5-3.0 mm) and peripheral (3.0-4.5 mm), revealed higher increase in the number of microglia in the regions closer to the optic disc.
