![]() Figure 3 of
Garcia-Valenzuela, Mol Vis 2005;
11:225-231.
Figure 3 of
Garcia-Valenzuela, Mol Vis 2005;
11:225-231.
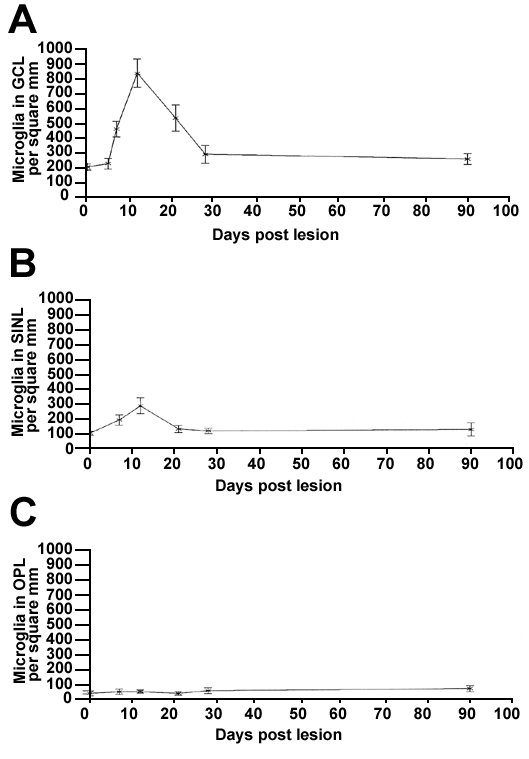
Figure 3. Post-axotomy changes of microglial density in different retinal layers
Graphs showing the mean number (error bars represent SEM) of microglial cells per mm2 in adult rat retina at 0, 7, 12, 21, 28, and 90 days following optic nerve transaction. Microglia was identified by OX42 immunoreactivity at 3 different retinal depths. Response in the GCL (A) was more robust than in the superficial inner nuclear layer (SINL; B); microglia in the OPL (C) did not increase in numbers.
