![]() Figure 2 of
Rollin, Mol Vis 2005;
11:216-224.
Figure 2 of
Rollin, Mol Vis 2005;
11:216-224.
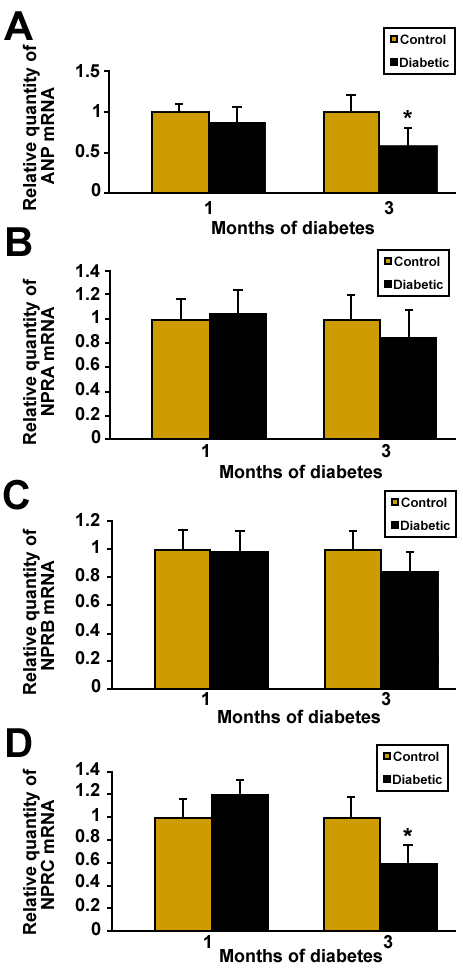
Figure 2. Amounts of ANP and NPR mRNA in the STZ diabetic rat retinas relative to the age matched control rat retinas
Relative quantification of ANP (A), NPRA (B), NPRB (C), and NPRC (D) gene expression in control and diabetic rat retinas 1 and 3 months after the administration of citric buffer or streptozotocin (STZ). Estimates of ANP and NPR mRNA levels were obtained from 12 rat retinas from each group (total of 48 retinas) using real-time quantitative RT-PCR. The normalized values for ANP and NPR mRNA were calculated by dividing the mean target mRNA quantity by the mean β-actin value for each retina. Relative ANPN and NPRN mRNA values for the target samples are plotted as a fraction of the normal retina reference value, which was arbitrarily set to 1. Error bars represent standard deviations based upon 3 separate experiments. Asterisks (*) mark statistically significant differences from control (p<0.05, Mann-Whitney U test).
