![]() Figure 5 of
Yamagami, Mol Vis 2005;
11:192-200.
Figure 5 of
Yamagami, Mol Vis 2005;
11:192-200.
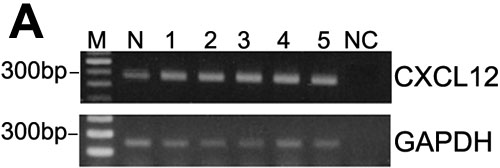
Figure 5. SDF-1/CXCL12 gene expression in normal and AKC patient conjunctivae
A: Representative band densities of the normal and AKC patients are compared within the linear range of amplification. Lane M shows the molecular weight marker (100 bp ladder). Lane N: Normal conjunctiva. Lane NC: Negative control. Lanes 1-5 correspond to the five patients. B: Normalized densities within the linear range of amplification are shown. SDF-1/CXCL12-mRNA levels in the giant papillae are significantly higher than in the normal conjunctivae as shown by densitometrical analysis of semi-quantitative RT-PCR findings. Values presented are means (n=4) and the error bars represent the standard deviation of the mean. Vertical axis shows arbitrary units based on densitometry. Similar results were obtained from two experiments.