![]() Figure 5 of
Normand, Mol Vis 2005;
11:184-191.
Figure 5 of
Normand, Mol Vis 2005;
11:184-191.
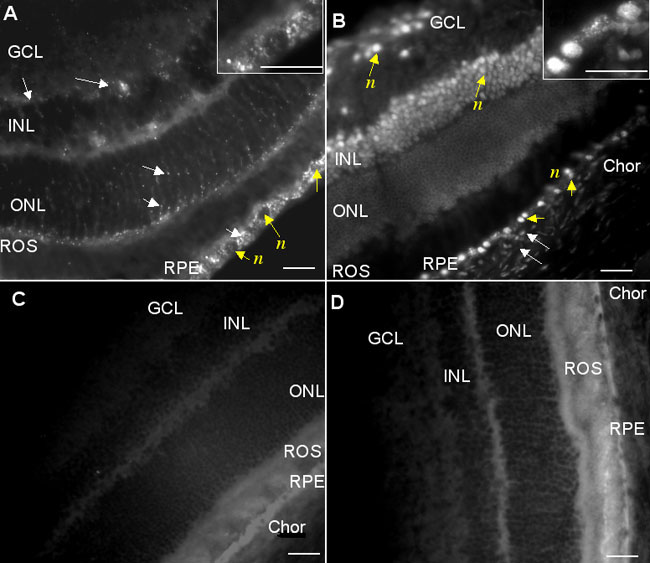
Figure 5. In vivo light controlled distribution of ODNs in the retina after intravitreal injection of vectosomes in the rat eye
Fluorescence microphotographs of retinal sections 24 h after intravitreal injections of vectosomes. A: Prior to illumination, vectosomes were dispersed in all retinal layers (white arrows). The inset shows RPE cells at higher magnification. B: After illumination, intense nuclear fluorescence was observed in ganglion, inner nuclear layer (INL), and RPE cells (yellow arrows). Fluorescence was also observed in choroid cell nuclei (white arrows). The inset shows RPE cells at higher magnification. C: 24 h after intravitreal injections of free ODNs, diffuse faint fluorescence was observed in the cytoplasm of RPE cells without illumination. D: 24 h after intravitreal injections of free ODNs, diffuse faint fluorescence similar to C was observed in the cytoplasm of RPE cells after illumination. An anti c-raf kinase ODN was used. The ODN was HEX labeled. The scale bars represent 10 μm.