![]() Figure 1 of
Talarico, Mol Vis 2005;
11:169-178.
Figure 1 of
Talarico, Mol Vis 2005;
11:169-178.
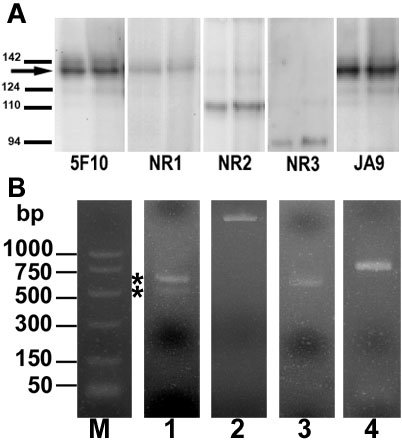
Figure 1. Isoform expression in native human corneal epithelium (hCE)
A: Immunoblot analysis of PMCA isoforms in hCE. Blot lanes were loaded with equal aliquots (about 20 μg protein) from two different samples of whole cell lysates of hCE. The panPMCA antibody (5F10) intensely labeled a band at about 135 kDa (arrow) and additional bands above and below that size (identified by markers to the left of the lane). Isoform specific PMCA antibodies (NR1, NR2, NR3, and JA9) detected bands that comigrated with one or more of the bands labeled by 5F10. 5F10 was used at 0.65 mg/ml. All other antibodies were used at 0.4 mg/ml. B: RT-PCR analysis of PMCA isoforms in human hCE. Total RNA extracted from native hCE was used for RT-PCR with specific primers across sites B and C for PMCA1, PMCA2, PMCA3, and PMCA4 (lanes 1, 2, 3, and 4, respectively). All lanes represent products obtained from second round PCR reactions. Lane M is PCR size markers. PCR products were separated by agarose gel electrophoresis and stained with ethidium bromide. PCR products were either gel purified or subcloned, then sequenced. In all cases, sequencing identified these products as the respective PMCA isoforms. Specifically, PCR amplification of PMCA1 (lane 1) yielded two fragments of 593 and 487 bp, respectively (asterisks). Sequences were identical to published sequences for human splice variants PMCA1b and PMCA1kb. PCR amplification of PMCA2 yielded fragments of 1,640 bp (lane 2, 99% identical to human PMCA2a) and 1,147 bp (not shown, a putative PMCA2kb splice variant). PCR amplifications of PMCA3 and PMCA4 each yielded a single fragment (lane 3; 632 bp and lane 4; 805 bp, that corresponded to PMCA3a and PMCA4b, respectively).