![]() Figure 2 of
Choudhary, Mol Vis 2005;
11:163-168.
Figure 2 of
Choudhary, Mol Vis 2005;
11:163-168.
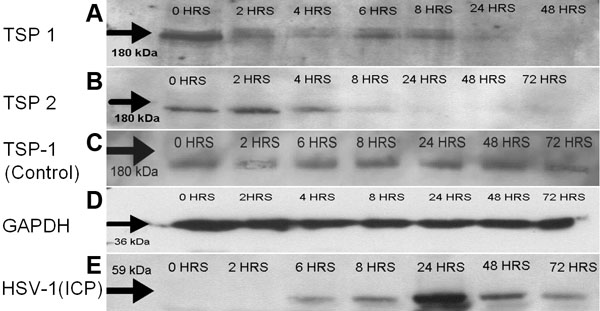
Figure 2. Western blot analysis
Protein expression of TSP1, TSP2, TSP1 (control), GAPDH, and HSV1:ICP27 at different time intervals ai. Densitometric analysis revealed there was a 50% reduction in the signal intensity of TSP1 (A) and TSP2 (B) by 8 h ai, with a complete absence by 24 h ai. There was no change in the expression of TSP1 in sham infected cultures (C). There was no change in the expression of GAPDH at any time ai (D). Immediate early viral proteins (HSV1:ICP27) were expressed by 6 h, reaching maximum intensity at 24 h ai (E).