![]() Figure 2 of
Pang, Mol Vis 2005;
11:152-162.
Figure 2 of
Pang, Mol Vis 2005;
11:152-162.
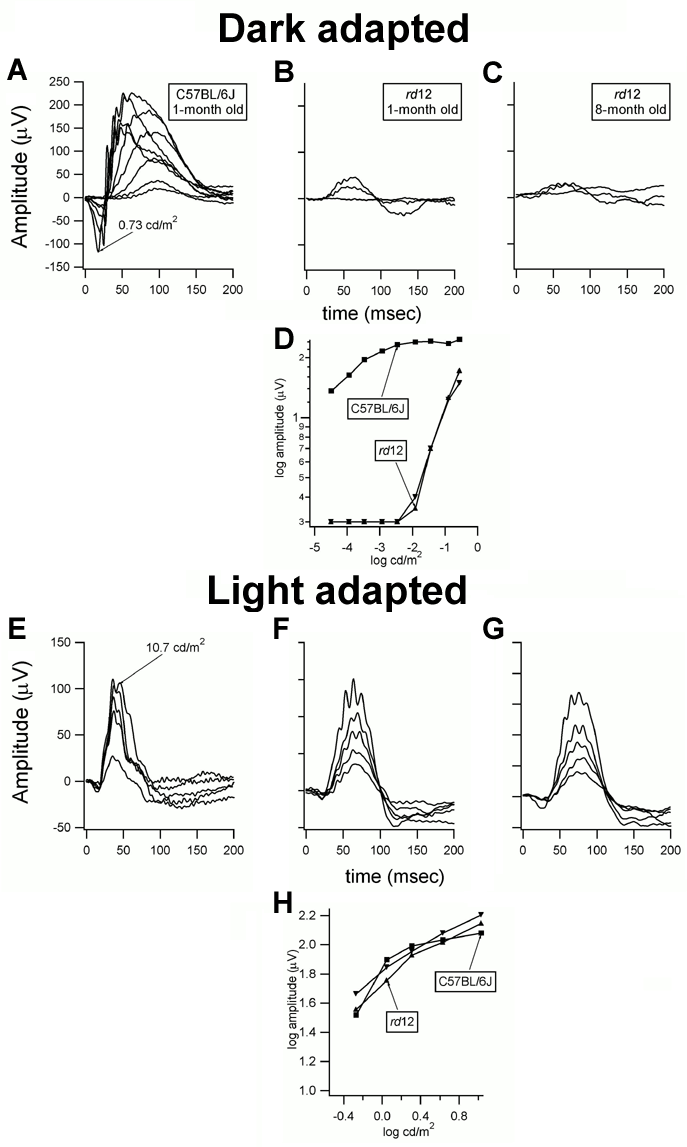
Figure 2. ERG responses under dark and light adapted conditions.
ERG responses under dark adapted (A-D) and light adapted (E-H) conditions. A and E: ERG responses from 1 month old C57BL/6J control mouse. ERG responses from representative 1 and 8 month old rd12 mice are shown under dark adapted (B and C, respectively) and light adapted (F and G) conditions. D and H: Amplitude versus intensity response functions under dark and light adapted conditions (squares equal to C57BL/6J; down triangle equal to rd12 at 1 month; up triangle equal to rd12 at 8 months).
