![]() Figure 3 of
Joo, Mol Vis 2005;
11:133-142.
Figure 3 of
Joo, Mol Vis 2005;
11:133-142.
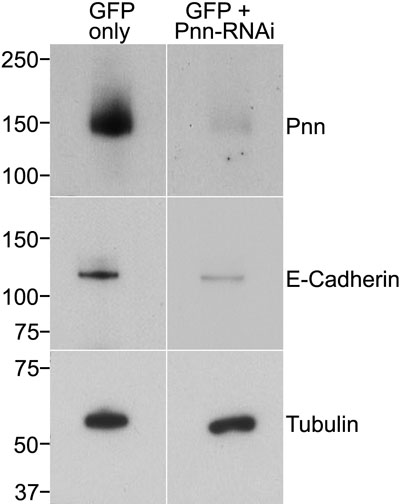
Figure 3. Immunoblot of Pnn, E-cadherin, and α-tubulin protein levels in HCE-T cells transfected with Pnn shRNAi
HCE-T cells were transfected with Pnn shRNAi/GFP vectors or GFP alone. After 24 h GFP positive cells were sorted by FACS, lysed and separated by SDS PAGE followed by western blotting for Pnn, E-cadherin, and α-tubulin. There was a distinct depression in the levels of Pnn from the Pnn-RNAi cells. Furthermore, levels of E-cadherin were reduced in the presence of Pnn RNAi when compared with GFP only controls. α-Tubulin levels illustrate equal total protein loading between samples.