![]() Figure 4 of
Kraft, Mol Vis 2005;
11:1246-1256.
Figure 4 of
Kraft, Mol Vis 2005;
11:1246-1256.
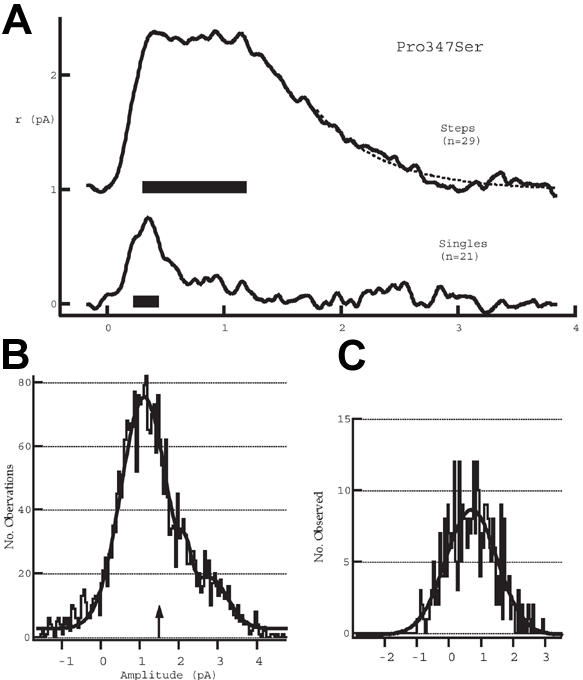
Figure 4. Dim flash responses in a P347S rod
One hundred flashes of 6.5 photons/μm2 (about 0.9 Rh*) were presented to a P347S rod producing on average about 1 R*. Imax=8.2 pA. The responses were sorted into four categories as follows: "Blanks", in which no response was observed (n=36); "Singles", where the response resembled the normal single-photon response (n=21); "Steps", where the response reached and maintained a plateau of current for up to 1 s (n=29); and "Combinations", which were 10 responses that were judged to be combinations of steps and singles. The remaining four responses were omitted from the analysis due to unusual noise in the record. A: The averages of the single and steps are plotted in the lower and upper graphs, respectively. The dashed curve fit to the trailing edge of the step response is an exponential function with a time constant of 643 ms. If the durations of the step currents were distributed exponentially then this time constant represents the mean lifetime of the step current. The time-to-peak of the singles (344 ms) matches that of the ensemble currents for this cell (349 ms). B: An amplitude histogram for all the current values of each of the 29 step responses over the period indicated by the black bar in A. The smooth curve is a fit of the sum of three Gaussians to the histogram. The peaks occur at 1.1, 2.2, and 2.8 pA. C: An amplitude histogram for the current values of each of the 21 single responses over the 120 ms period indicated by the black bar in Panel A. The smooth curve is the fit of a single Gaussian function centered at 0.7 pA and with a width of 1.1 pA.
