![]() Figure 7 of
Rex, Mol Vis 2005;
11:1236-1245.
Figure 7 of
Rex, Mol Vis 2005;
11:1236-1245.
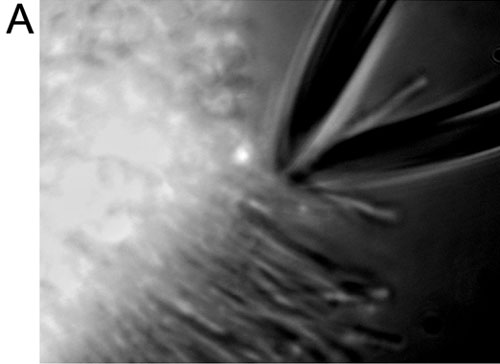
Figure 7. Rods with high levels of enhanced green fluorescent protein have normal phototransduction
A: Epifluorescence image of a slice of retina from mouse expressing EGFP under control of the b-actin promoter. A single outer segment has been drawn into a suction pipette, which is connected by a salt bridge to a current-to-voltage converter. B: Family of responses of a single rod expressing EGFP to a series of flashes of increasing intensity. At least five responses to the same flash intensity were averaged for each trace, up to 60 individual records were used to obtain the averaged responses to the dimmest flashes. Responses by the amplitude of the saturated response, 16 pA. C: Traces from Panel B shown on faster time scale and fitted with a model of the activation phase of phototransduction (gray traces) [21,33]; the value of the amplification constant, A is given on the graph. D: Response peak amplitude (left ordinate) and time to 40% recovery of circulating current (right ordinate) plotted as a function of flash intensity for the responses from Panel B; the amplitude versus flash intensity data were fitted with a hyperbolic saturation function whose half-saturating intensity is given on the figure. Recovery time versus flash intensity data for saturating responses were fitted with a straight line; the slope of the line per e-fold change in flash intensity gives the dominant time constant of recovery tD.