![]() Figure 3 of
Rex, Mol Vis 2005;
11:1236-1245.
Figure 3 of
Rex, Mol Vis 2005;
11:1236-1245.
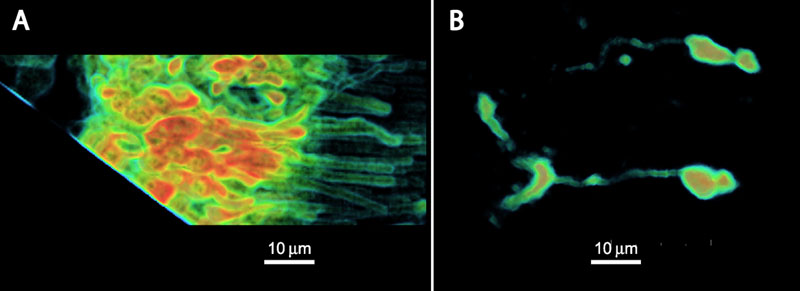
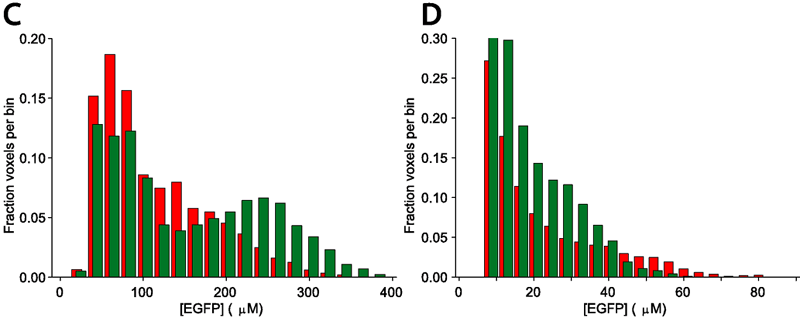
Figure 3. Determination of the concentration of enhanced green fluorescent protein in living photoreceptors
A: Confocal fluorescence image of a slice of live retina of mouse expressing EGFP under control of the β-actin promoter. B: Confocal image of slice of live retina of mouse expressing EGFP under control of the human L/M cone opsin promoter. The intensities of EGFP fluorescence from the voxels in both images have been mapped onto a pseudocolor scale that ranges from blue (low intensity) to high (red). C,D: Histograms of the intensity distributions of the voxels of two rods from C and the two cones in D; the intensities have been converted to the concentrations of EGFP, as described [22]. The concentrations estimated for the 4 cells are 250 μM (red bars in C) and 314 μM (green bars in C), 41 μM (green bars in D), and 54 μM (red bars in D).