![]() Figure 4 of
Nakamura, Mol Vis 2005;
11:1229-1235.
Figure 4 of
Nakamura, Mol Vis 2005;
11:1229-1235.
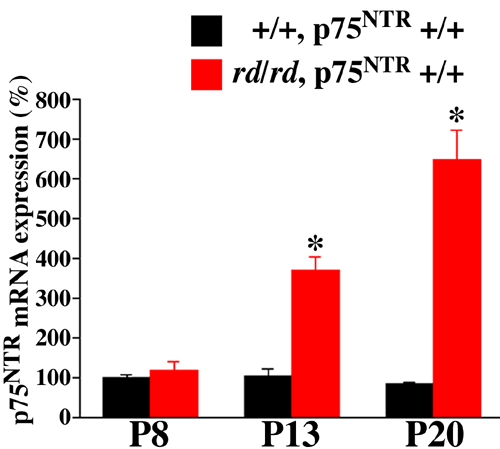
Figure 4. Upregulation of p75NTR mRNA expression in rd/rd mice
Quantitative analysis of p75NTR mRNA expression in +/+, p75NTR +/+ mice (black bars) and rd/rd, p75NTR+/+ mice (red bars). Real-time PCR analysis was carried out at P8, P13, and P20. p75NTR mRNA expression in +/+, p75NTR+/+ mice at P8 is shown as 100%. Note the significant upregulation of p75NTR in rd/rd, p75NTR+/+ mice at P13 and P20. No statistically significant differences were observed from P8 to P20 in +/+, p75NTR+/+ mice. On the other hand, p75NTR mRNA expression in rd/rd, p75NTR+/+ mice was increased at P13 and P20 compared with that in +/+, p75NTR+/+ mice. Each data point represents the mean of values obtained from six independent experiments; error bars represent the SEM. Asterisk (*) indicates p<0.001 for comparison to +/+, p75NTR+/+.
