![]() Figure 7 of
Shimauchi-Matsukawa, Mol Vis 2005;
11:1220-1228.
Figure 7 of
Shimauchi-Matsukawa, Mol Vis 2005;
11:1220-1228.
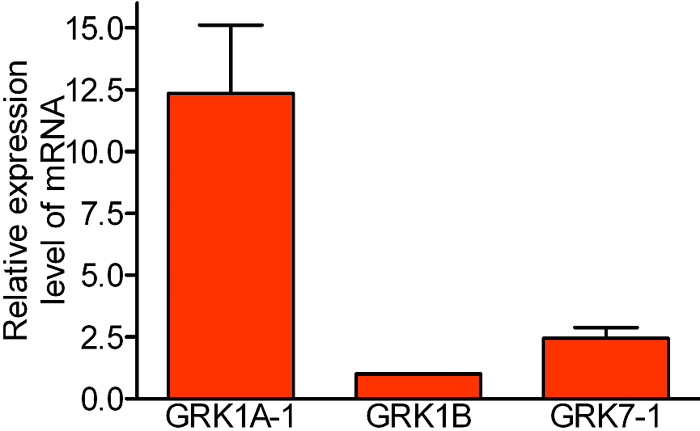
Figure 7. Relative mRNA expression levels of GRK1A-1, GRK1B, and GRK7-1
The mRNA expression levels of GRK1A-1 and GRK7-1 relative to that of GRK1B were determined with semiquantitative RT-PCR. The error bars represent the standard error of the mean (n=11).