![]() Figure 5 of
Robinson, Mol Vis 2005;
11:1211-1219.
Figure 5 of
Robinson, Mol Vis 2005;
11:1211-1219.
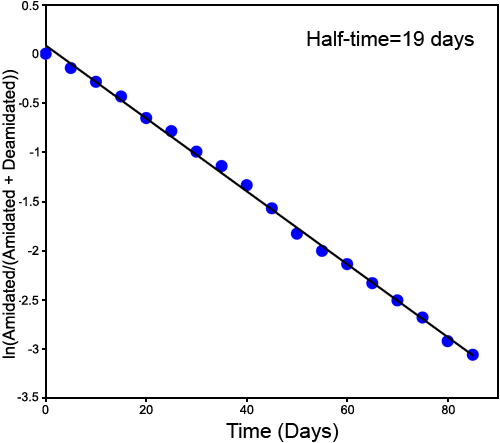
Figure 5. Second deamidation of GlyAsnAsnAsnGly
The first-order deamidation rate curve for the second deamidation of GlyAsnAsnAsnGly, using deamidation of the first singly deamidated peak. This figure is ln[B/(B+C+D)] versus time. The measured deamidation half-time is 19 days. The quantitative linearity and zero deamidation intercept of the plot demonstrate that this deamidation has been accurately and separately measured by the mass defect ICR FTMS technique.
