![]() Figure 3 of
Robinson, Mol Vis 2005;
11:1211-1219.
Figure 3 of
Robinson, Mol Vis 2005;
11:1211-1219.
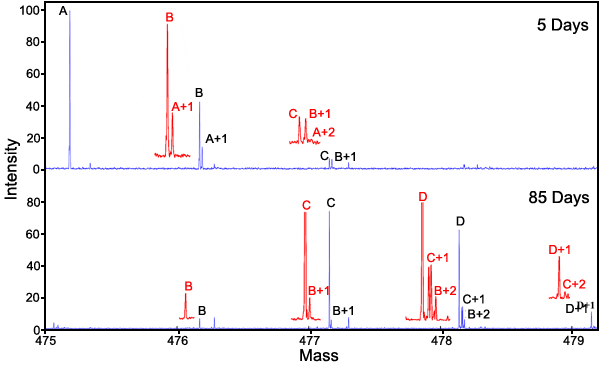
Figure 3. Mass spectrum of the deamidation samples at 5 and 85 days of GlyAsnAsnAsnGly
The peptide was incubated in 37.00 °C, pH 7.4, 0.15 M Tris-HCl buffer. It was diluted 100 fold in H2O and then further diluted 3 fold with 49/49/2 H2O/methanol/acetic acid before being introducted by electrospray into the Fourier transform mass spectrometer. Peak A is the first isotopic peak. Peak B is the deamidation product from deamidation of the first isotopic peak. Peak A+1 of the doublet is the second isotopic peak. Peak C is the second deamidation peak of the first isotopic peak, peak B+1 is the first deamidation peak of the second isotopic peak, and peak A+2 is the third isotopic peak. The quadruplet shows the third deamidation peak of the first isotopic peak, the second deamidation product of the second isotope peak, the first deamidation product of the third isotope peak, and the fourth isotopic peak. Only one mass defect peak is observed for the fifth isotopic peak quintuplet because the amounts of deamidated products were low. Insets are magnified 2.5x.
