![]() Figure 3 of
Nguyen, Mol Vis 2005;
11:1183-1199.
Figure 3 of
Nguyen, Mol Vis 2005;
11:1183-1199.
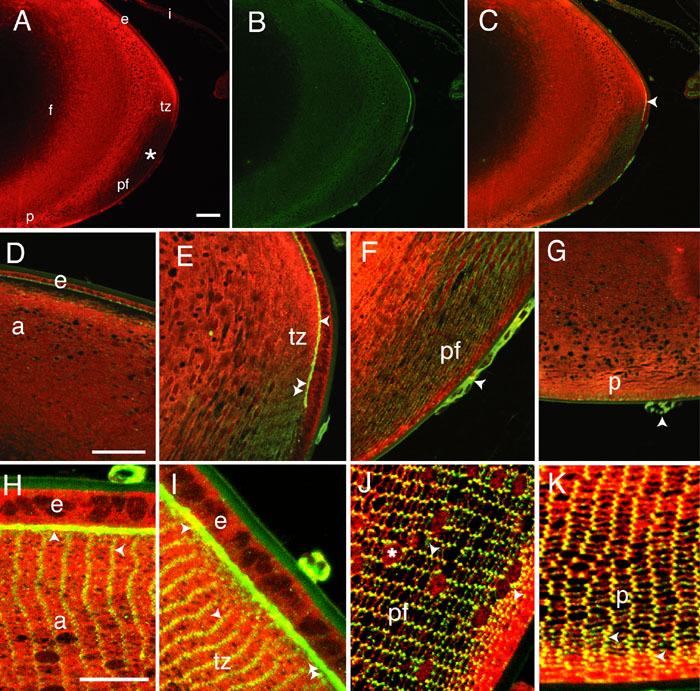
Figure 3. Co-localization of Dlg-1 and ZO-1 in the lens
To determine if Dlg-1 co-localized with ZO-1 in the epithelial and fiber cells of the lens, we conducted double immunofluorescence experiments on eye sections from P10 mice. Staining for Dlg-1 and ZO-1 overlapped strongly at the epithelial-fiber interface and on the short sides of the fiber cells in the outer cortex. The figure shows immunofluorescent staining in the lens for Dlg-1 only (A), ZO-1 only (B), and Dlg-1, and ZO-1 (C-K). A-G are longitudinal sections and H-K are transverse sections showing the regions corresponding to those in D-G. A-C are at low magnification, D-G are at intermediate magnification, and H-K are at high magnification. Staining for Dlg-1 is red, staining for ZO-1 is green, and overlap in staining for Dlg-1 and ZO-1 is yellow. The arrowheads in C,E show overlap in staining for Dlg-1 and ZO-1 in the apical interface between the epithelium and fiber cells. The asterisk in A shows the apparent lack of staining for Dlg-1 in this region. The arrowheads in F,G shows staining for ZO-1 (green) and Dlg-1 with ZO-1 (yellow) in blood vessels adjacent to lens capsule. The arrowheads in H-K show punctate overlapping pattern (yellow) of Dlg-1 and ZO-1 at the epithelial-fiber interface (H,I) and basal attachments (J,K) as well as on the short sides of the fibers (H-K). The double arrowhead in I shows the presence of ZO-1 only at the epithelial-fiber interface at the posterior of the transition zone (see double arrowheads in E for reference). The asterisk shows Dlg-1 staining in the nuclei in the posterior fiber region. Note the non-overlapping pattern of Dlg-1 and ZO-1 staining on the long sides of the fibers. The anterior (apical) region of the lens fiber cells (a), lens epithelium (e), lens fiber cells (f), transition zone (tz), midposterior fibers (pf), posterior (basal) region of the lens (p), and iris (i) are identified. In all panels the anterior of the eye is oriented at the top. The scale bars represent 100 μm in A-C; 50 μm in D-G; and 25 μm in H-K.