![]() Figure 2 of
Nguyen, Mol Vis 2005;
11:1183-1199.
Figure 2 of
Nguyen, Mol Vis 2005;
11:1183-1199.
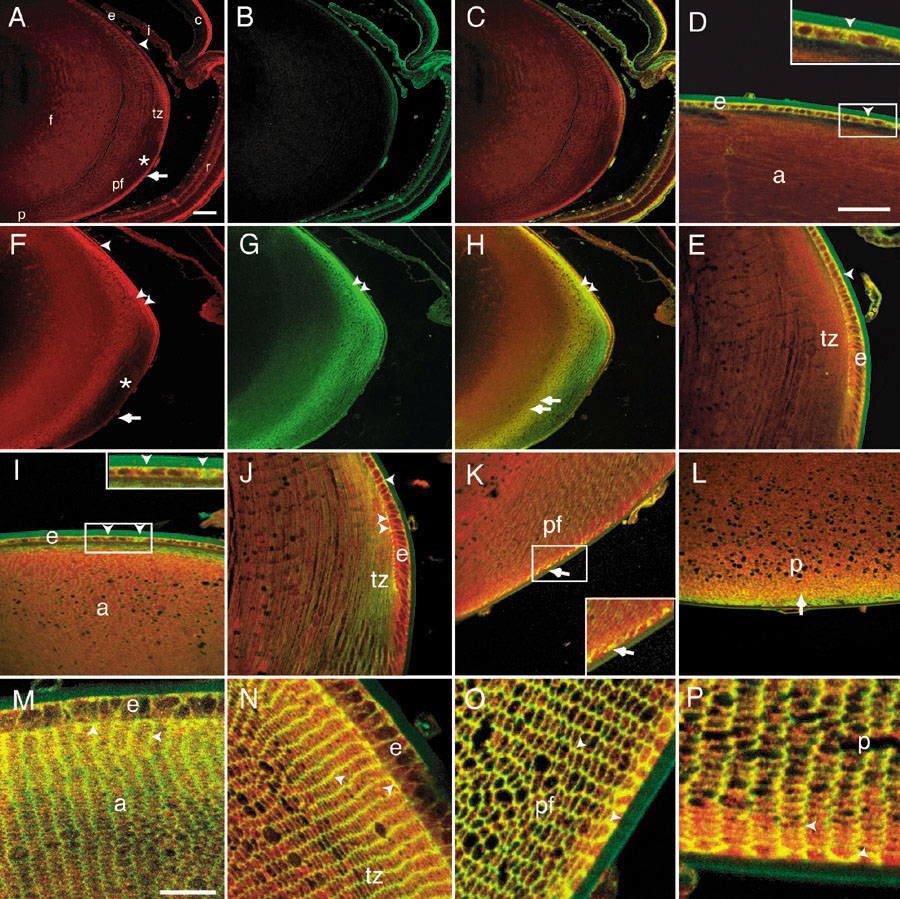
Figure 2. Co-localization of Dlg-1 with E- and N-cadherin in the lens
To determine if Dlg-1 co-localized with E- or N-cadherin in the epithelial and fiber cells of the lens, we conducted double immunofluorescence experiments on eye sections from P10 mice. Staining for Dlg-1 and E-cadherin overlapped on the baso-lateral membranes of the epithelial cells. Staining for Dlg-1 and N-cadherin overlapped in the epithelium and in the fibers. The overlap in the fibers was most notable at the apical and basal tips of the and was primarily found on the short sides of the fiber cells. The figure shows immunofluorescent staining for Dlg-1 only (A,F), E-cadherin only (B), N-cadherin only (G), Dlg-1, and E-cadherin (C-E) and Dlg-1 and N-cadherin (H-P). A-C,F-H are at low magnification; D-E,I-L are at intermediate magnifications; and M-P are high magnification. Dlg-1, red staining; E- or N-cadherin, green staining; yellow, overlap. The arrowhead in A,F show Dlg-1 staining in the epithelium. The double arrowheads in F show strong Dlg-1 staining in the apical regions of fiber cells. The double arrowheads in G show strong N-cadherin staining in apical regions of the fiber cells. The double arrowheads in H show strong overlap in Dlg-1 and N-cadherin staining in apical regions of the fiber cells. The arrows in A,D show strong Dlg-1 staining at the basal tips of fiber cells. The double arrows in H show overlap on lateral membranes of some fiber cells. The asterisks in A,F show an apparent reduction in or lack of staining for Dlg-1 in this region. The arrowhead in D shows overlap in staining of Dlg-1 and E-cadherin in the basal and lateral membranes of the epithelium. The arrowhead in E shows overlap in Dlg-1 and E-cadherin staining in the transition zone. The arrowhead in I shows overlap in Dlg-1 and N-cadherin staining along the basal and lateral surfaces of the epithelial cells, arrowheads in J show overlap in staining in cells of the transition zone. The arrows in K,L show overlap in the fiber cells. The insets in D,I,K show the detail of overlapping staining patterns in the regions corresponding to the areas in white boxes in their respective panels. Overlap in staining of Dlg-1 and E-cadherin on the basolateral surface of the epithelium is observed in D, inset, arrowhead. Overlap in staining of Dlg-1 and N-cadherin on the basal surface of the epithelium is seen in I, inset, arrowhead, Overlap in staining of Dlg-1 and N-cadherin on the lateral surfaces of the fibers in the posterior fiber region is seen in K, inset, arrow. In M-P, arrowheads show overlap (yellow) in staining of Dlg-1 and N-cadherin on the short sides of the fiber cells. Note that staining for Dlg-1 is also observed on the long sides of the fiber cells in M-P, the cytoplasmic staining adjacent to the capsule that is lost more interiorly in O,P, and the non-overlapping pattern of Dlg-1 and N-cadherin staining on the long sides of the fibers in O,P. The anterior (apical) region of the fiber cells (a), lens epithelium (e), lens fiber cells (f), cornea (c), transition zone (tz), midposterior fibers (pf), posterior region (basal region) of the lens fibers (p), and retina (r) are identified. In all panels, the anterior of the eye is oriented at the top. The scale bars represent 100 μm in A-C,F-H; 50 μm in D,E,I-L; 25 μm for the insets in D,I,K; and 25 μm for M-P.