![]() Figure 5 of
Nakazawa, Mol Vis 2005;
11:1173-1182.
Figure 5 of
Nakazawa, Mol Vis 2005;
11:1173-1182.
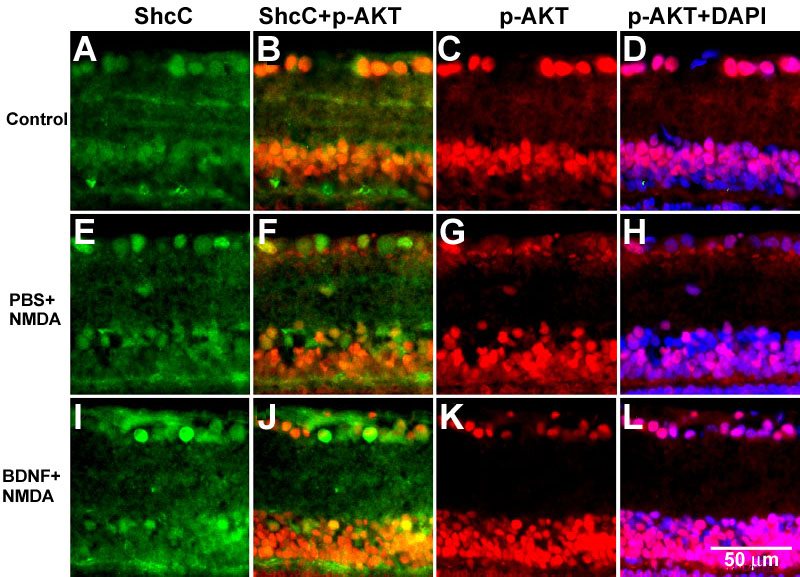
Figure 5. Phosphorylated Akt and N-Shc/ShcC positive cells in NMDA-treated retina
A-L: Representative photograph of double immunohistochemistry with phosphorylated Akt (p-AKT) and N-Shc/ShcC antibody (ShcC). A-D: Untreated control (Control). E-H: 1 h after 20 nmol NMDA injection pretreated with PBS (PBS+NMDA). I-L: 1 h after 20 nmol NMDA injection pretreated with 1 μg BDNF (BDNF+NMDA). A,E,I: Immunoreactivity of ShcC (ShcC). B,F,J: Merged images of immunoreactivity of ShcC and p-Akt (ShcC+p-AKT). C,G,K: Immunoreactivity of p-Akt (p-AKT). D,H,L: Merged images of immunoreactivity of p-Akt and DAPI nuclear staining (p-AKT+DAPI). BDNF prevents NMDA-induced dephosphorylation of Akt. M: The table shows the quantitative data of the percentage of p-Akt positive (+) neurons in all neurons, p-Akt (+) neurons in ShcC positive (+) neurons, and ShcC (+) neurons in all neurons. Asterisk represents significant decrease compared to PBS group (*) or PBS+NMDA group (**). Pretreatment with BDNF reverses NMDA induced dephosphorylation of Akt but it is not fully reversed compared to the PBS group. However, if we exclude the cells which lack a BDNF response (ShcC negative cells), there is no significant difference between PBS and BDNF-treated groups.
M:
               pAkt(+)          pAkt(+)          ShcC(+)
             neurons per      neurons per      neurons per
            total neurons   ShcC(-) neurons   total neurons
---------   -------------   ---------------   -------------
PBS         98.1 ±  3.1      97.0 ± 3.5        67.5 ± 11.4
PBS+NMDA    59.1 ± 10.5*     51.2 ± 10.2*      60.9 ±  8.5
BDNF+NMDA   80.5 ±  8.0**    86.5 ± 12.6**     56.9 ± 11.6
|