![]() Figure 4 of
Nakazawa, Mol Vis 2005;
11:1173-1182.
Figure 4 of
Nakazawa, Mol Vis 2005;
11:1173-1182.
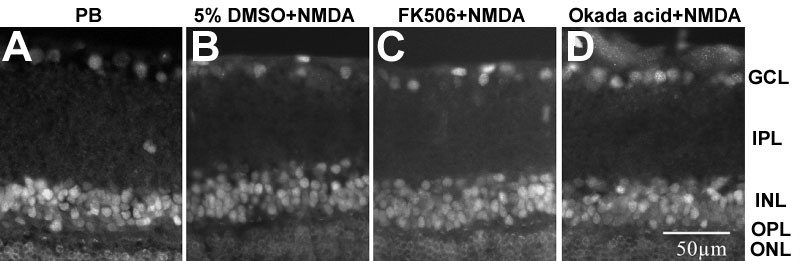
Figure 4. NMDA-induced dephosphorylation of Akt is protein phosphatase-1/-2A dependent
A-D: Representative photography of immunoreactivity with phosphorylated Akt antibody (p-Akt). A: 1 h after phosphate buffer (PB) injection. B: 1 h after 20 nmol NMDA injection pretreated with 5% DMSO. C: 1 h after 20 nmol NMDA injection pretreated with FK-506 (FK506, 200 pmol). D: 1 h after 20 nmol NMDA injection pretreated with Okadaic acid (Okada acid, 20 pmol). Okadaic acid prevents NMDA induced dephosphorylation of Akt in GCL. E: Bar chart indicates the percentage in number of p-Akt positive cells in all neurons under different treatment of phosphatase inhibitors in GCL. Okadaic acid significantly prevents NMDA induced dephosphorylation of Akt. Asterisk indicates statistically significant difference compared to the vehicle control (ANOVA followed by Scheffe post hoc test).