![]() Figure 3 of
Nakazawa, Mol Vis 2005;
11:1173-1182.
Figure 3 of
Nakazawa, Mol Vis 2005;
11:1173-1182.
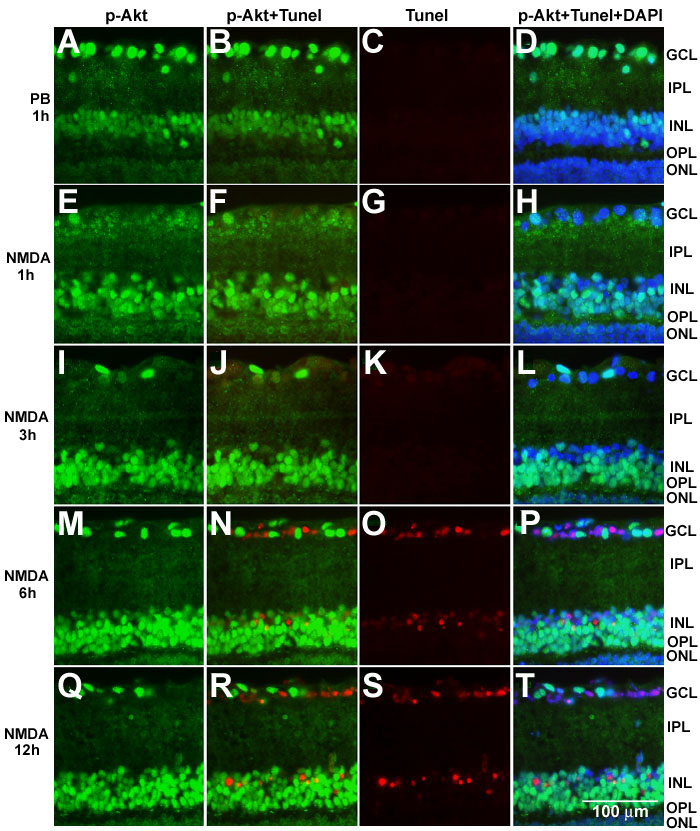
Figure 3. Double staining with phosphorylated Akt antibody and TUNEL in NMDA-treated retina
A-T: Representative photographs of double staining with phosphorylated Akt antibody (p-Akt) and TUNEL 1 h after vehicle control (PB 1h) or 200 nmol NMDA injection at different time points. A-D: 1 h after phosphate buffer injection (PB 1h). E-E: 1 h after NMDA injection (NMDA 1 h). I-L: 3 h after NMDA injection (NMDA 3 h). M-P: 6 h after NMDA injection (NMDA 6 h). Q-T: 12 h after NMDA injection (NMDA 12 h). A,E,I,M,Q: Immunoreactivity of p-Akt. B,F,J,N,R: Merged images of immunoreactivity of p-Akt antibody and TUNEL (pAkt+Tunel). C,G,K,O,S: TUNEL. D,H,L,P,T: Merged images of triple staining, immunoreactivity of p-Akt antibody, TUNEL, and DAPI nuclear staining (p-Akt+Tunel+DAPI). NMDA induced dephosphorylation of Akt within 1 h. TUNEL positive cells are detected at 6 and 12 h after NMDA injection. TUNEL and immunoreactivity of p-Akt are never colocalized. U: Time course analysis of p-Akt positive cells and TUNEL positive cells in GCL. Y-axis of the green bar indicates the percentage of p-Akt positive neurons in all DAPI positive cells and the red bar indicates the percentage of TUNEL positive cells in all DAPI positive cells in GCL. The percentage of p-Akt positive cells is significantly decreased between 1 h (1h) to 12 h (12h) after 200 nmol NMDA treatment and the level is constant. Asterisk indicates statistically significant difference compared to the vehicle control (ANOVA followed by Scheffe post hoc test). V: Quantitative data of total neurons in GCL. The cell numbers are not changed within 12 h after NMDA administration. The data show that the decrease of p-Akt immunoreactivity is due to dephosphorylation, not protein degradation.