![]() Figure 2 of
Nakazawa, Mol Vis 2005;
11:1173-1182.
Figure 2 of
Nakazawa, Mol Vis 2005;
11:1173-1182.
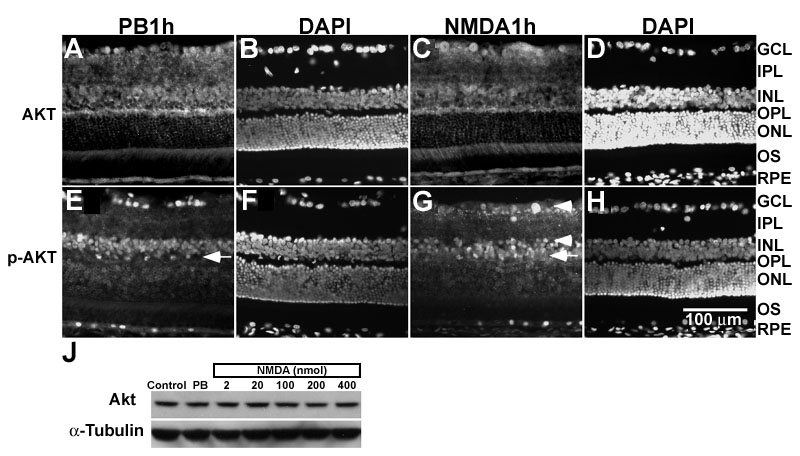
Figure 2. Akt and phosphorylated Akt positive cells in NMDA-treated retina
A-H: Representative photographs showing the immunoreactivity of Akt (AKT; A-D) and phosphorylated Akt (p-Akt; E-H) in rat retina treated with vehicle control, phosphate buffer (PB; A,B,E,F) or 200 nmol NMDA (C,D,G,H) 1 h after injection (PB1h, NMDA1h). B,D,F,H show DAPI nuclear staining corresponding images to A,C,E,G, respectively. Arrows in E,G indicate the bipolar cell layer. NMDA induced dephosphoryaltion of Akt in GCL and inner margin of INL (G, arrowhead). The ganglion cell layer (GCL), inner plexiform layer (IPL), inner nuclear layer (INL), outer plexiform layer (OPL), outer nuclear layer (ONL), outer segment (OS), retinal pigment epithelium (RPE) are identified. J: Representative photographs of western-blot of rat retina treated with different doses of NMDA (2 to 400 nmol) 1 h after injection, untreated control (Control) and vehicle control with phosphate buffer (PB). The intensity of band with Akt antibody (Akt) was not changed by different doses of NMDA. I: Bar chart shows the quantitative data of p-Akt positive cells in GCL 1 h after different doses of NMDA (2 to 400 nmol) injection. The number represents the percentage of p-Akt positive cells in all DAPI-positive cells in the GCL. P-Akt positive cells decreased significantly after 20 nmol or more of NMDA injection. Asterisk indicates statistically significant difference compared to the vehicle control (ANOVA followed by Scheffe post hoc test).