![]() Figure 1 of
Nakazawa, Mol Vis 2005;
11:1173-1182.
Figure 1 of
Nakazawa, Mol Vis 2005;
11:1173-1182.
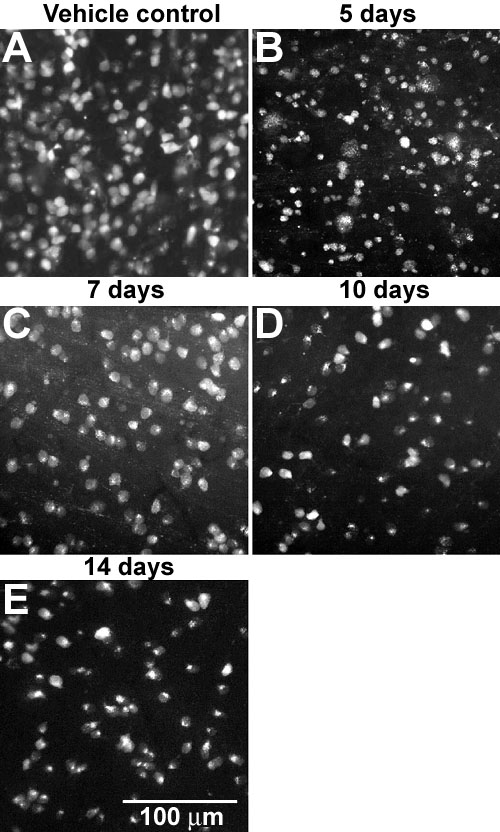
Figure 1. Time course change and dose response curve of fluorochrome labeled RGCs following NMDA injury
Representative photographs of flat mounted fluorochrome labeled RGCs at various time points following 200 nmol NMDA injection (A-E) and quantitative data of time course of surviving RGCs (F) and the dose-response curve 7 days after NMDA injection (E). A: Vehicle control. B: 5 days. C: 7 days. D: 10 days. E: 14 days. The density of RGC decreased significantly 5 days after NMDA injection and there was no further RGC loss from 7 to 14 days. 2, 20, and 200 nmol of NMDA induced significant loss of RGC compared to vehicle control (unpaired t-test) and there was no significant difference between 20 and 200 nmol of NMDA.