![]() Figure 2 of
Warburton, Mol Vis 2005;
11:1122-1134.
Figure 2 of
Warburton, Mol Vis 2005;
11:1122-1134.
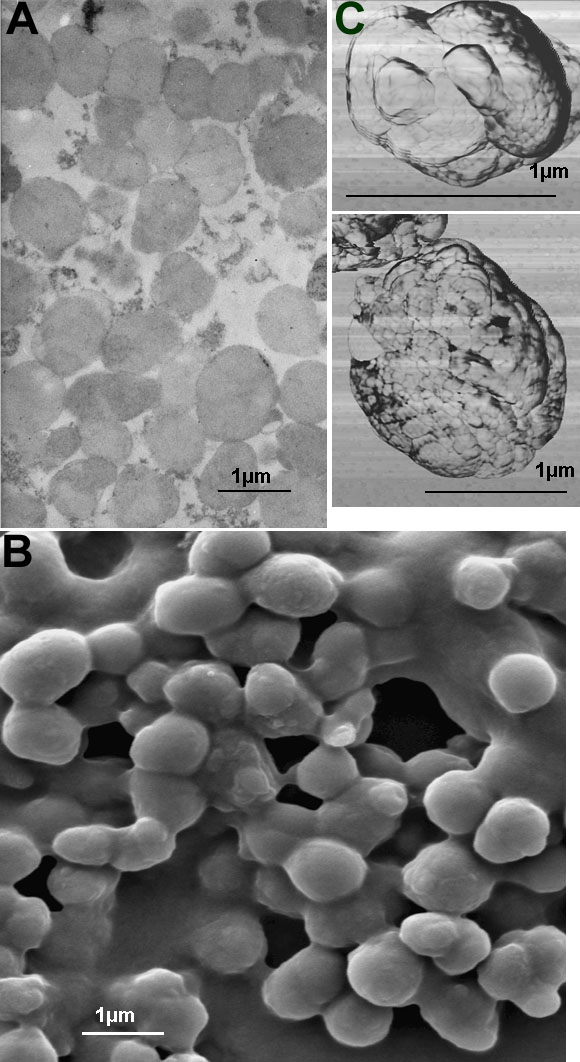
Figure 2. Microscopy of RLF granules
A: Transmission electron micrograph of RLF, showing granules of homogeneous density. B: Scanning electron micrograph of RLF, showing nearly spherical granules with some surface features. C: Atomic force micrographs (phase images) showing RLF granules to be aggregates of about 200 nm (upper panel) and about 50 nm (both panels) substructures. AFM images were processed offline to remove the background slope using software bundled with the AFM instrument. Then granule size was more quantitatively determined using flow cytometric analysis (FC). Forward light scatter in FC instruments is directly proportional to the size of the objects passing through the beam. The RLF granules were found to be distributed into two populations by size, one (representing 99% of the granules) having a mean diameter of 0.69 μm with a Gaussian distribution and a broad standard deviation of 0.63 μm, and the other population (representing only 1% of the granules) having a mean diameter of 4.8 μm with standard deviation of 0.3 μm. The larger granules are not melanosomes because their fluorescence properties (measured by flow cytometry) match RLF, not melanosomes. Flow cytometry also enabled a quantitative determination of the concentration of granules in our suspensions. Having a quantitative count of the RLF granules we were able to determine their average weight, which proved to be 1.3±0.2 pg/granule.