![]() Figure 1 of
Zinchuk, Mol Vis 2005;
11:114-123.
Figure 1 of
Zinchuk, Mol Vis 2005;
11:114-123.
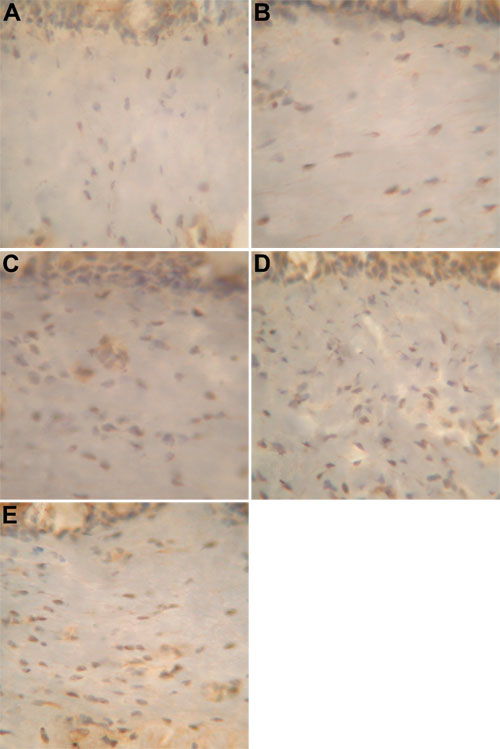
Figure 1. Immunohistochemical visualization of PAF-R antigen
A control is shown in A. An increase of the number of PAF-R positive cells is seen at 30 min (B) and 2 h (C) after PAF administration. The number of the cells increases considerably at 6 h (D). It continues to grow by 24 h (E). Representative images of three examined eyes are shown. Magnification x400.