![]() Figure 8 of
Liu, Mol Vis 2005;
11:1112-1121.
Figure 8 of
Liu, Mol Vis 2005;
11:1112-1121.
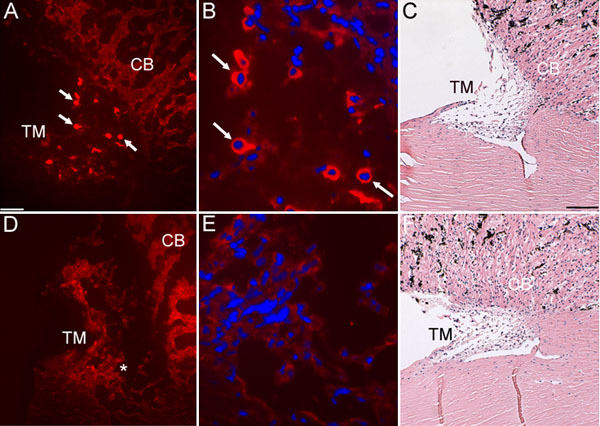
Figure 8. C3 transferase localization in AdC3GFP-transduced organ cultured monkey anterior segment
A-C: AdC3GFP-transduced eye. D-F: AdGFP-transduced eye. Frozen sections were labeled for C3 transferase (red channel, A,B,D,E) and cell nuclei (blue channel, B,E). Paraffin-embedded sections (C,F) were stained with hematoxylin and eosin. B,E: Magnified images of trabecular meshwork (TM) cells seen in A and D, respectively. Arrows indicate C3 transferase-positive TM cells; corresponding cells in A,B are indicated. The asterisk in D indicates the region magnified in E. The scale bar represents 50 μm in A,B,D,E and 100 μm in C,F.