![]() Figure 6 of
Liu, Mol Vis 2005;
11:1112-1121.
Figure 6 of
Liu, Mol Vis 2005;
11:1112-1121.
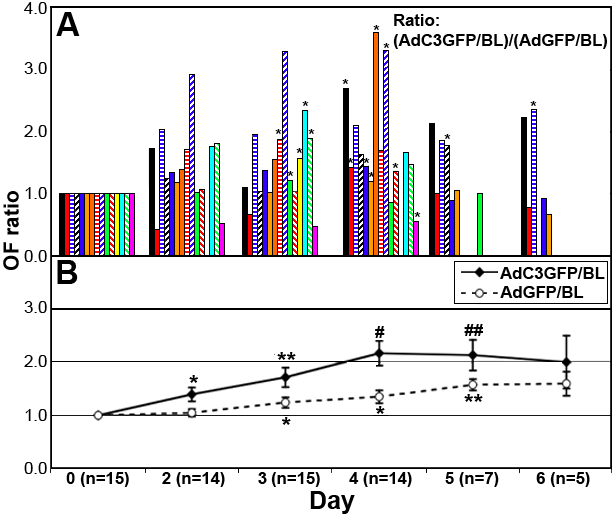
Figure 6. Time course of outflow facility response following AdC3GFP and AdGFP transduction
The baseline (BL) was measured on day 0, then one anterior segment received 1.2x10⁸ viral particles (80 μl) of AdC3GFP while the opposite anterior segment received the same dose of AdGFP. Post-treatment OF was monitored thereafter. A: Bar graph, time course for the change in the outflow facility ratio for each pair of anterior segments (different filled bars). Data are the ratio of post-treatment OF compared to baseline OF and corrected by contralateral control anterior segment washout. The asterisk indicates the maximum response to AdC3GFP for each anterior segment that was used to calculate OF in Table 1. B: Graph of the daily average (mean±SEM) OF for AdC3GFP and AdGFP treated segments corrected for BL. AdGFP/BL indicates the control anterior segment washout. Ratios were significantly different from 1.0 by the 2-tailed paired t-test. The single asterisk indicates a p<0.05, the double asterisk indicates a p<0.005, the single sharp (hash mark) indicates a p<0.001, and the double sharp indicates p<0.01.
